BACKGROUND
Self-regulation is the ability to manage impulses in order to take goal-directed actions (Murray et al., 2019). While there are various definitions of self-regulation, researchers generally agree that it involves regulation of emotions, thoughts, and behaviors (Groß, 2021). These aspects are closely interrelated, with each influencing and reinforcing the others. For instance, failure to regulate an emotion like anger can lead to impulsive behavior and hinder the ability to focus on goals or anticipate consequences. Effective self-regulation is thus important for making thoughtful decisions, maintaining focus, and achieving long-term objectives. Therefore, developing self-regulation skills can improve overall well-being and effectiveness in both personal and professional contexts, as it directly impacts one’s ability to manage stress and adapt to changing circumstances (Murray et al., 2019).
Research has consistently highlighted the importance of self-regulation across various aspects of personal development and well-being. For instance, a longitudinal study by Morosanova et al. (2021) revealed that self-regulation was important in maintaining well-being and life satisfaction during school transitions. Similarly, Calmeiro and colleagues (2018) identified self-regulation as a predictor of life satisfaction. Self-regulation is also positively linked to self-esteem (Sawalhah & Al Zoubi, 2020) and self-efficacy (Džinović et al., 2019), positive thinking, and optimism (Gordon et al., 2016). At the same time, individuals with low self-regulation skills tend to experience more social anxiety (Strauman & Eddington, 2017) and are more likely to engage in violent behaviors (Plessen et al., 2023).
Self-regulation skills develop from early childhood until old age (Richmond-Rakerd et al., 2021). The ability to self-regulate undergoes the most rapid development during the first decade of life, when it is learned mainly through co-regulation and modeling provided by caregivers or peers (Biglan et al., 2012). Early interventions are believed to be most effective in developing self-regulation (Murray et al., 2019). However, there is a growing body of research showing that self-regulation programs may be beneficial to adolescents and emerging adults as well, and adults in their midlife (Richmond-Rakerd et al., 2021).
The interplay between the emotional, cognitive and behavioral self-regulation and their variability across situations and individuals makes self-regulation complex to understand and measure. Although individuals use various strategies for self-regulation, capturing these through self-reports is challenging, particularly in children and adolescents, who often use them automatically. Because self-regulation frequently operates below conscious awareness (Fitzsimons & Bargh, 2004), researchers focus on outcomes such as emotional dysregulation or inattentiveness, which more clearly indicate challenges in managing emotions, thoughts, and behaviors. While this approach offers practical assessment, it may not fully capture the complexity of the underlying processes.
Given the complex nature of the construct of self-regulation and its adaptive properties, it is essential to present standardized methods that enable a reliable measurement of self-regulatory skills. This will facilitate targeted interventions and strategies to enhance self-regulation for individuals of all ages, benefiting diagnostic and therapeutic processes, as well as daily functioning. Additionally, a tool for measuring self-regulation can be utilized in scientific research to explore the relationships between self-regulation and other psychological variables.
SELF-REGULATION SCALE
In the field of psychological and educational research, it is common to assess self-regulation by self-report tools, e.g. the Self-Regulation Scale (SRS) by Novak and Clayton (2001). The original SRS consists of 26 items that tap three dimensions of self-regulation: cognitive, emotional, and behavioral. We screened articles using SRS and found prevalent use of the short version of the scale (Coyne et al., 2019; Moilanen et al., 2018; Zhou et al., 2017). However, to the best of our knowledge, there is no scientific article devoted to the psychometric properties of the short version of the SRS.
AIM OF THE STUDY
This study aimed to develop and validate the Polish short version of the SRS in a group of adolescents and adults. In line with findings from previous studies (Gajda et al., 2022; Zhou et al., 2017), we hypothesized that the three-factor structure of the tool would be successfully replicated through factor analyses.
PARTICIPANTS AND PROCEDURE
PROCEDURE
The process of item selection for the short SRS was guided by several premises. First, we based our analysis on the theory of self-regulation as a multidimensional construct (Murray et al., 2019). We assumed that the structure of the shortened tool should correspond to the original, three-subscale structure of the SRS. The long version of the scale is characterized by a satisfactory Cronbach’s α reliability coefficient, ranging from .83 to .86 obtained in the Polish adaptation and validation of the scale (Gajda et al., 2022). The respondents answer on a 4-point scale from 1 (never true) to 4 (always true). A higher overall score indicates a higher level of self-regulation and its components.
We wanted to obtain between three and five items per factor as suggested by Raubenheimer (2004) for psychological scales. Then, we took into consideration the obtained values of adjusted item-total correlation coefficients, and factor loading values from the previous study on the Polish version of the SRS (Gajda et al., 2022). To ensure that the empirical methods did not limit item content, we examined each item for meaning and importance relative to key aspects of the construct. Also, as we wanted to make the tool applicable to various age groups, we decided not to choose item 20 in the behavioral dimension (“I have difficulty remaining seated at school or at home during dinner”). No item wording or response changes were introduced. The obtained version of the shortened SRS consists of 12 items, with 4 items per factor interspersed across the tool.
In order to analyze the psychometric properties of the 12-item scale, we conducted three separate studies. Convenience sampling was used to involve the respondents in all studies. The respondents of Study 1 were school-aged adolescents from seven public elementary schools in Poland. They completed questionnaires in electronic form at schools in the presence of a trained interviewer. The consent of adolescents’ legal guardians or parents was obtained before participation. The respondents in Studies 2 and 3 were recruited through advertisements placed on social media sites (e.g. Facebook) and were groups of adults up to 70 years of age and young adults, respectively. These studies were conducted using online surveys. The results of Study 1 and Study 2 were used for confirmatory factor analysis (CFA). The results of Study 3 were used to assess the construct validity of the short SRS. Before the study, each respondent was informed about the purpose of the study and assured of its anonymous and voluntary nature. Each participant gave informed and voluntary consent to participate in the study.
PARTICIPANTS
A total of 1,525 respondents (n = 925 women; 60.66%) aged 14 to 70 participated in the three independent studies. The research samples differed from each other in terms of demographic characteristics.
Study 1. The first study involved 573 adolescents (n = 291 girls; 50.8%) aged 14 to 16 (M = 14.72, SD = 0.47). All participants were elementary school students.
Study 2. The second study involved 324 participants aged 18 to 70 (M = 33.51, SD = 13.38). The majority were women (n = 170; 52.5%) and people with secondary (n = 177; 54.6%) and higher (n = 133; 41%) education background.
Study 3. The third study involved 628 young adults (n = 464 women; 73.9%) aged 21 to 35 (M = 24.97, SD = 3.56). Among the respondents, 314 had secondary education (50%) and 301 had higher education (47.9%); 2 people had primary (0.3%) and 2 had lower secondary education (0.3%), 9 people had basic vocational education (1.4%).
MEASURES
Respondents from Study 3 completed the short SRS and six additional psychometric tools. The choice of the tools was guided by theoretical assumptions about self-regulation and findings from prior studies, indicating positive and negative relationships between the variables and self-regulation (e.g. Šarić Drnas, 2022; Yanhong et al., 2021). We expected a three-factor solution for the SRS, with cognitive, emotional, and behavioral regulation being negatively correlated with state-trait anxiety and aggression, and positively associated with self-esteem, positive orientation, satisfaction with life, and self-efficacy.
The Rosenberg Self-Esteem Scale (SES) developed by Rosenberg (1965) and adapted into Polish by Dzwonkowska et al. (2008) is a one-factor tool used to measure the perception of general self-esteem understood as a conscious and global attitude towards the Self. Respondents answer 10 statements on a 4-point scale from 1 (strongly agree) to 4 (strongly disagree). The Cronbach’s α was .90.
The Positive Orientation Scale (P Scale) developed by Caprara et al. (2012) and adapted into Polish by Łaguna et al. (2011) is a self-report one-factor tool used for assessing the tendency to focus on positive aspects of life. The scale consists of 8 items, for which answers are provided on a 5-point Likert scale, with the response options ranging from strongly disagree to strongly agree. The Cronbach’s α was .87.
The Satisfaction with Life Scale (SWLS) is a one-factor 5-item scale designed to measure global cognitive judgments of one’s life satisfaction developed by Diener et al. (1985) and adapted into Polish by Juczyński (2001). Participants indicate how much they agree or disagree using a 7-point scale that ranges from 7 (strongly agree) to 1 (strongly disagree). The Cronbach’s α was .87.
The State-Trait Anxiety Inventory (STAI; Spielberg et al., 1983; in a Polish adaptation by Spielberg et al., 2006) is a one-factor tool that can be used to measure anxiety understood as a personality trait. The tool consists of 20 statements and has a 4-point response scale from 1 (almost never) to 4 (almost always). The Cronbach’s α was .90.
The General Self-Efficacy Scale (GSES) is a 10-item self-report measure of general self-efficacy developed by Schwarzer and Jerusalem (1995) and adopted into Polish by Schwarzer et al. (2007). Answers are given on a 4-point scale from 1 (not at all true) to 4 (exactly true) with a higher score indicating more self-efficiency. The Cronbach’s α was .88.
The Buss-Perry Aggression Questionnaire (BPAQ; Buss & Perry, 1992) was used to measure anger. The BPAQ is a self-report tool used to identify four aggressive tendencies – physical aggression, verbal aggression, anger and hostility, and overall aggression. The questionnaire consists of 29 statements assessed on a 5-point Likert-type scale from 1 (extremely uncharacteristic of me) to 5 (extremely characteristic of me). The Cronbach’s α was in the range .76-.89.
RESULTS
STATISTICAL ANALYSIS
All analyses were performed using IBM SPSS Statistics 26.0 and IBM SPSS AMOS 21.0 with the maximum likelihood estimation method. Before exploratory factor analysis (EFA) and confirmatory factor analysis (CFA), data were verified in terms of missing data and outliers. A factor analysis assumption test was performed.
DESCRIPTIVES
In the first step of the statistical analysis, basic descriptive statistics of all psychological variables from three studies were calculated, along with the results of the Shapiro-Wilk test of normality (Supplementary materials Table S1). The results of the Shapiro-Wilk test indicate that all variables had distributions significantly different from the Gaussian distribution (p < .05); however, this could have been caused by large sample sizes (Krithikadatta, 2014). Despite this, all the obtained values of skewness and kurtosis were in the range of ±1, which indicates a slight deviation from the normal distribution (Hair et al., 2017).
EXPLORATORY FACTOR ANALYSIS
In the first step of estimating the structure of the constructed short version of the tool, an EFA was performed on the observations from the second study (N = 324) taking into account its greatest degree of heterogeneity referring to the criterion of the age of the respondents in relation to the other samples. The obtained value of the K-M-O coefficient (= 0.72) met the assumption of the zero-order correlations relative to the partial correlations between pairs of variables. The statistically significant value of Bartlett’s sphericity test (χ2(66) = 1017.41, p < .001) indicates sufficient shared variance (Tabachnick et al., 2007).
The number of factors was extracted based on an eigenvalue greater than 1 and oblique rotation direct Oblimin with Kaiser normalization with the critical factor load value below 0.4 (Schmitt & Sass, 2011). There emerged four dimensions that explained over 50% of the variance in total, which can be considered a weak but acceptable value (Pallant, 2020).
Based on the analysis of the model matrix (Supplementary materials Table S2), it was observed that all the items had factor loading values higher than 0.4 and none of them loaded more than one dimension. Items 1, 4, 7, and 10 assigned to the first dimension were identical in terms of content to the emotional dimension, and items 2, 5, 8, and 11 loaded the cognitive dimension as expected. A significant change in the tool’s structure was the split of the behavioral dimension into two distinct factors with items 3 (“I get very fidgety after a few minutes if I am supposed to sit still”) and 6 (“I can’t seem to stop moving”) and 9 (“I have difficulty keeping attention on tasks”) and 12 (“Little things throw me off when I am working/studying”), respectively.
Due to the results of the EFA and subsequent results from the CFA, we decided to take on the four-factor structure of the tool for further analysis. Based on the content of the four items (3, 6, 9, 12), which were previously included in the behavioral dimension, we decided to assign items 3 and 6 to the newly created hyperactivity scale and items 9 and 12 to the behavioral attention scale. Hyperactivity is characterized by one’s restlessness and constant movement, including in situations when it is not considered appropriate, and behavior such as excessive fidgeting, tapping, or talking (Ross & Ross, 1976). Behavioral attention refers to the ability to stay focused on the task at hand and engage in activity until the task is complete or a certain time has elapsed (Fortenbaugh et al., 2015).
CONFIRMATORY FACTOR ANALYSIS
To confirm the structure observed in the EFA, we conducted a confirmatory factor analysis (CFA) in two independent samples. We assumed that well-fit models would achieve acceptable relative χ2 value below 5, GFI, AGFI, NFI, and CFI above 0.9, RMR below 0.05, and RMSEA below 0.08 (Byrne, 2013; Tabachnick et al., 2007).
The results of several CFAs were performed and compared using data from Study 1 and Study 2. First, using the first-order factor model comparison (Supplementary materials Figure S1), the three-factor structure of the scale and the four-factor structure were analyzed based on the obtained EFA results. In the last step, the higher-order factor model analysis was carried out with the division of the behavioral dimension into two separate subscales (Figure 1). All models were compared in terms of the obtained fit index values (Table 1).
The obtained fit index values indicate a good fit of all models for both data sets. The exception is the NFI index, which did not exceed 0.9 (Tabachnick et al., 2007). However, in terms of factor loadings, the three-factor structure of the scale indicates relatively low values for some items that did not exceed 0.5 and as a result should be removed from the tool structure (Awang et al., 2015). Both the four-factor first-order model and higher-order factor models obtained satisfactory fit indices and factor loadings. Detailed comparisons indicate a slightly better fit of the higher-order model for Study 3 in terms of the values of normed χ2 (2.69 vs. 2.78) and RMSEA (0.05 vs. 0.06).
Figure 1
Confirmatory factor analysis (CFA) models for the short version of the Self-Regulation Scale
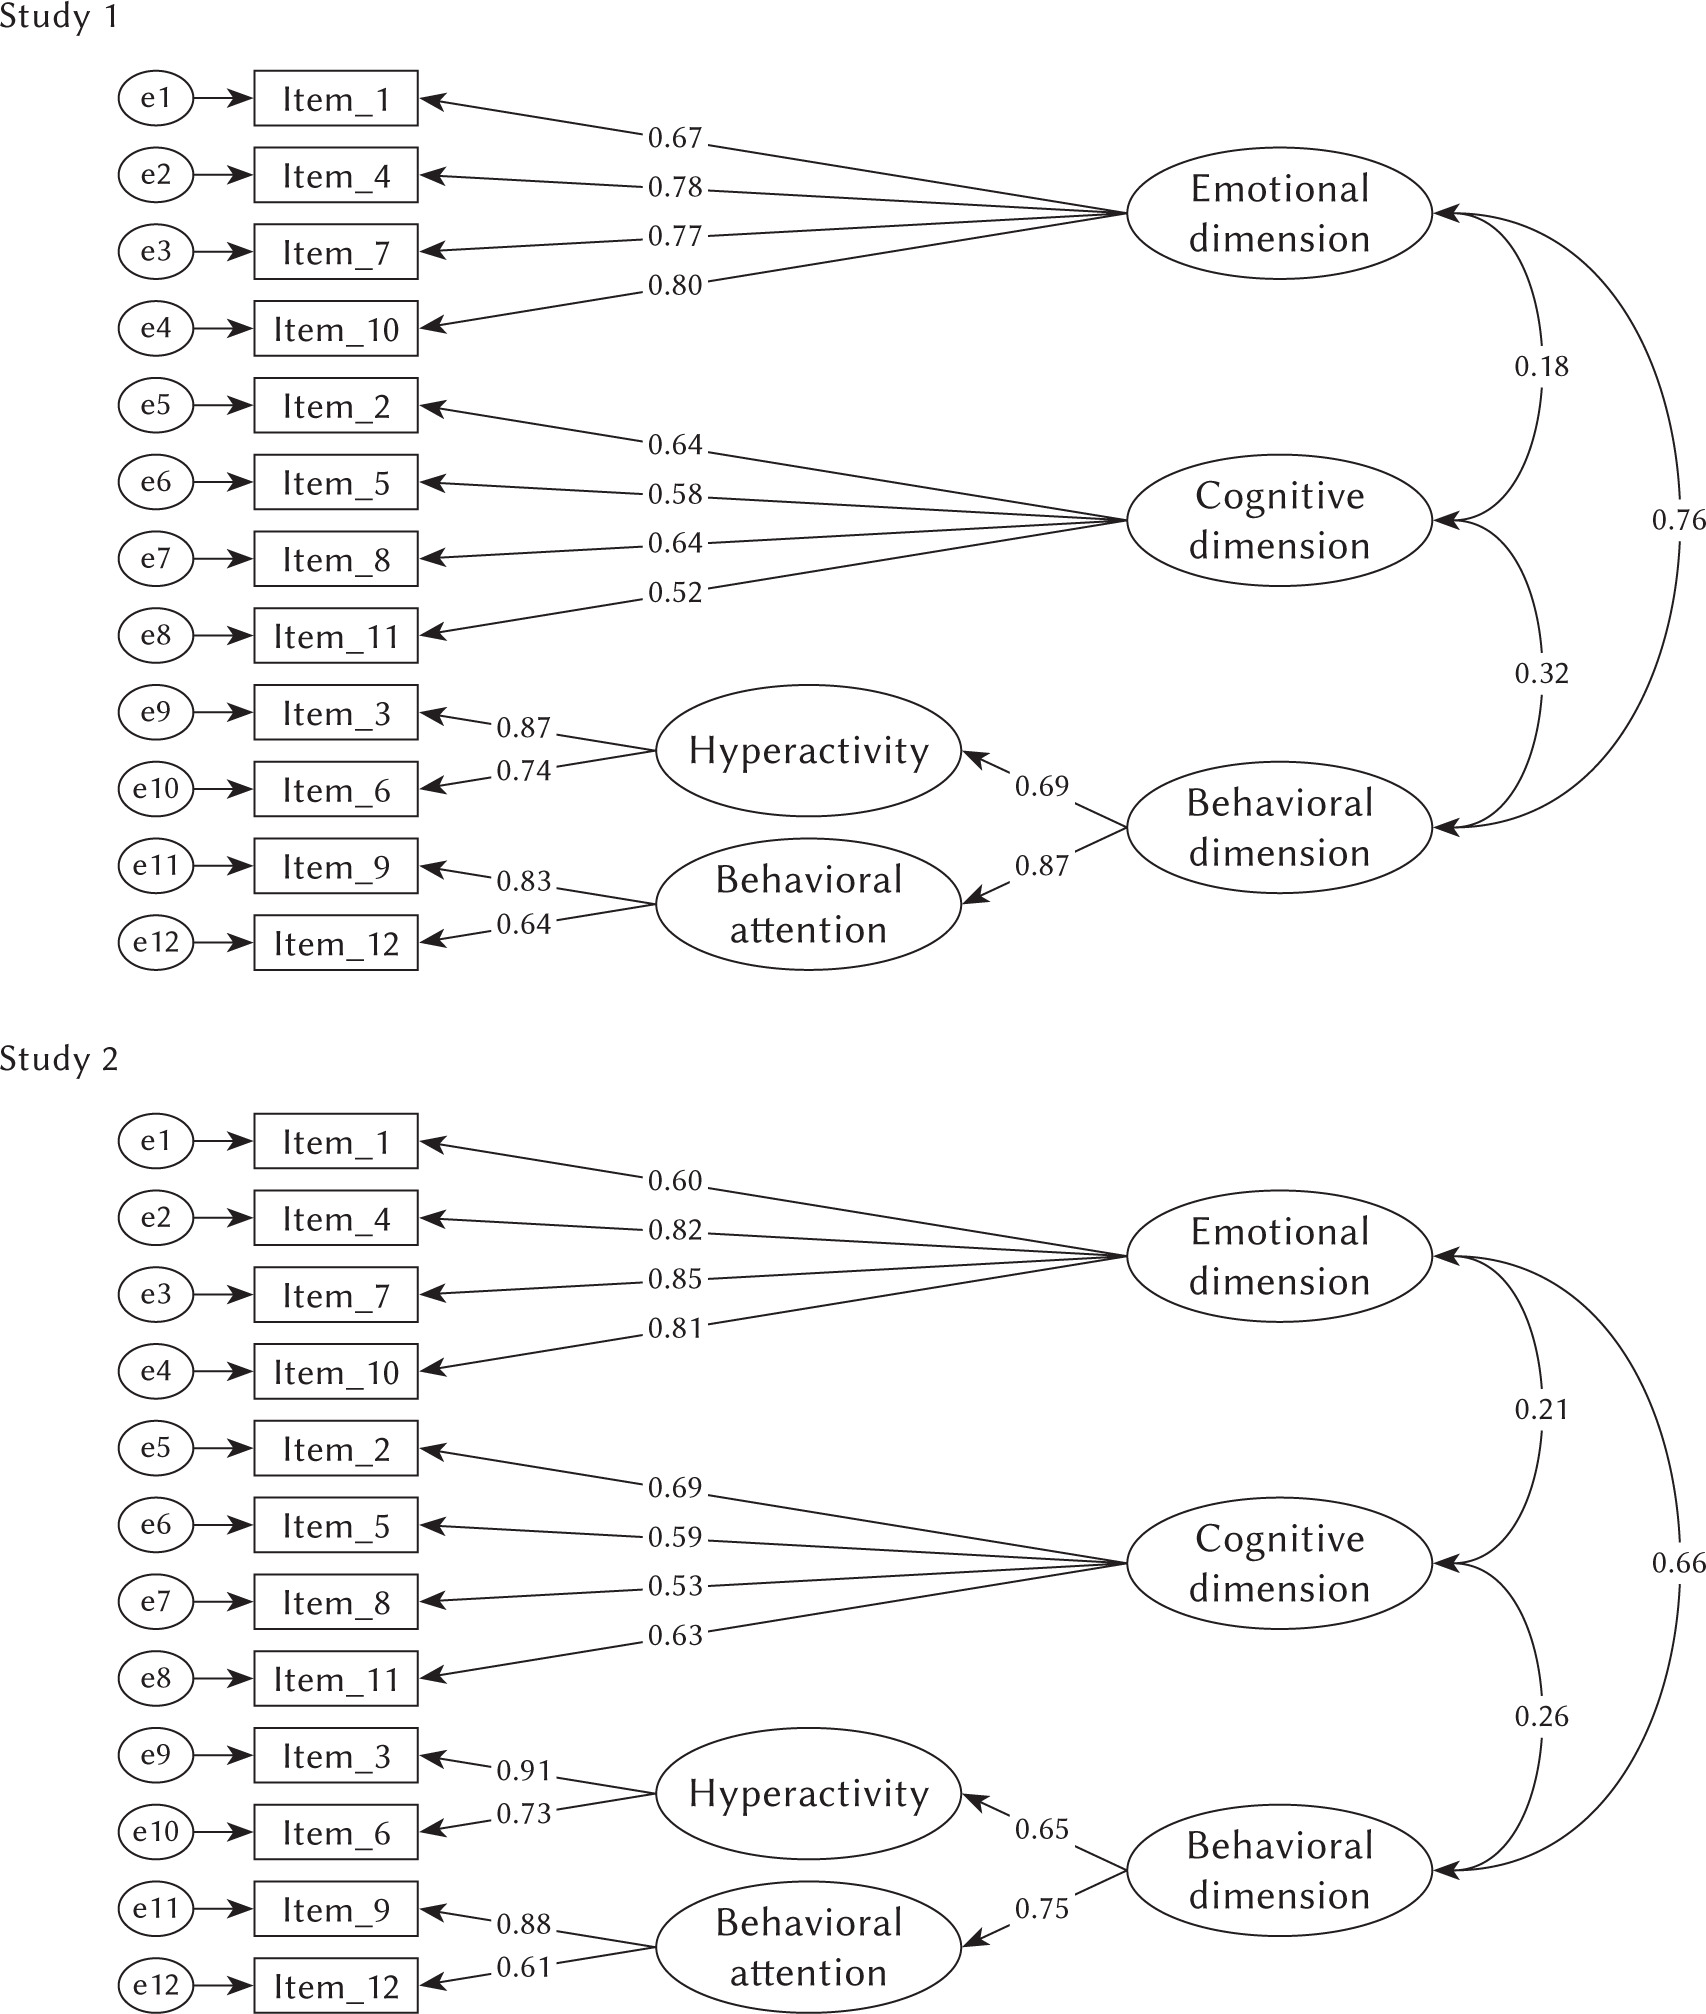
Table 1
Model fit indices
Table 2
Values of the Pearson r correlation coefficient
RELIABILITY AND VALIDITY
The results obtained in all three studies indicate acceptable values of Cronbach’s α reliability coefficient for overall self-regulation (.73-.80). The lowest coefficients were obtained for the cognitive dimension (.63-.68), and the highest for the emotional dimension (.82-.84).
Pearson’s r correlation coefficient was used to analyze the convergent validity of the tool and estimate the level of correlation between overall self-regulation and its dimensions and selected variables from Study 3 (Table 2).
The obtained results indicate statistically significant (p < .001) and positive correlation coefficients between the general level of self-regulation and self-esteem (r = .39), positive orientation (r = .37), satisfaction with life (r = .38) and general self-efficacy (r = .43) and a negative correlation with trait anxiety (r = –.55) and aggression (r = –.58). Similar correlations were observed for dimensions of self-regulation. The exception was the cognitive dimension, which did not correlate statistically significantly (p > .05) with verbal aggression (r = –.07) and hostility (r = –.04), and the hyperactivity subscale, which did not correlate significantly with self-esteem (r = .12), positive orientation (r = .05), satisfaction with life (r = .08), and general self-efficacy (r = .05). In addition, the behavioral attention dimension did not correlate significantly with physical aggression (r = –.05, p > .05).
DISCUSSION
The main objective of the study was to develop a shortened version of the Self-Regulation Scale. Based on the obtained results, it can be concluded that the proposed 12-item shortened version of the SRS (sSRS) is characterized by satisfactory psychometric properties. The additional division of the behavioral dimension into two higher-order factors, i.e., hyperactivity and behavioral attention, can be justified by the theory and research conducted on the behavioral symptoms of low self-regulation (Moilanen et al., 2018). This division highlights significant complexity in self-regulation.
The EFA results did not support the three-factor model of self-regulation. Thus, we decided to analyze the first-order factor model with four dimensions and compare it with the higher-order factor model in CFA. It can be assumed that both models are characterized by similar psychometric properties and values of fit indices. To align the model with theoretical assumptions about the three-dimensional structure of the self-regulation construct, we added two second-order factors to the behavioral dimension, which helps to keep the structure of the sSRS consistent with the structure of the original tool (Gajda et al., 2022; Novak & Clayton, 2001). The distinction regarding hyperactivity and behavioral attention as part of self-regulation aligns with previous studies (Richmond-Rakerd et al., 2021).
The models in each study explained about 50% of the total variance, which can be considered a threshold value (Pallant, 2020). Also, each factor explained more than 5% of the variance, which is an acceptable result (Hair et al., 2014). A similar total variance explained was obtained in other studies (Gajda et al., 2022; Zhou et al., 2017), which indicates the consistency of the tool. The lack of differences in the values of fit indices between adolescents (Study 1) and young adults (Study 2) indicates that the tool is universal and can be used for measuring self-regulation among these age groups.
The convergent validity of the tool showed that there was a positive relationship between self-regulation and self-esteem, positive orientation, life satisfaction, and self-efficacy, which is consistent with findings from previous studies (Yanhong et al., 2021). In addition, there was a negative relationship between self-regulation and anxiety, as well as between self-regulation and aggression, which also is in line with previous findings (Šarić Drnas, 2022).
The results of this study demonstrate positive relationships between self-regulation and factors typically associated with psychological well-being and overall quality of life (Medvedev & Landhuis, 2018). From a developmental psychology perspective, high self-esteem – reflecting how one’s behavior is perceived by others – is crucial during adolescence and emerging adulthood when identity formation is taking place (Alsaker & Kroger, 2006). Positive self-esteem, supported by high self-regulation, can improve life satisfaction and self-efficacy (Refaeli et al., 2018). Furthermore, self-regulation is negatively related to aggression and anxiety. Recent studies confirmed the mediating role of self-regulation between self-esteem or self-efficacy and aggressive behavior (Gao et al., 2021).
The proposed tool shows satisfactory psychometric properties and it can be used to measure the overall level of self-regulation understood as the ability to manage emotions, cognitive processes, and impulses to take goal-directed actions (Murray et al., 2019), and to measure its three main dimensions.
LIMITATIONS
The study has several limitations. First of all, a cross-sectional design was used in the study and not time-series cross-sectional data collection. Thus the results cannot be interpreted in terms of cause-and-effect relationships. A limitation resulting from the method of conducting the study is the inability to perform a test-retest measure to accurately estimate the reliability of the scale. Moreover, the lack of other Polish-language tools for measuring self-regulation prevented us from accurately testing the convergent validity of the scale. One proposal for further validation in the Polish context is to compare its results with those of the Self-Control Scale (Kwapis & Bartczuk, 2020), given the integrated and synonymous nature of both of these variables as presented in the literature (Groß, 2021). Moreover, further validation of the sSRS should be performed using a longitudinal design, which will enable the interpretation of the obtained results in terms of the trait and analysis of its potential impact on psychosocial functioning at subsequent stages of life. Another limitation of our study was that we did not control for personality variables or mental health problems. The presence of identity disorders or attention deficit hyperactivity disorder among the participants could be of potential significance as these conditions are closely tied to the regulation of cognitive, emotional, and behavioral functioning (Barkley, 2011; Cibrian et al., 2022). The online survey limited our control over the way respondents completed the survey. The results of factor analyses did not fully support the three-factor structure of self-regulation. The proposed higher-order factor model should be confirmed in further research using the sSRS.
CONCLUSIONS
Despite the limitations, the Polish version of the short Self-Regulation Scale (sSRS) can be accepted as a valid and reliable measure for assessing overall self-regulation scores in Polish samples. The shortened SRS can be recommended for use in both scientific research and psychological practice. However, to fully support practical application, it is advisable to create norms with cut-off values for low, medium, and high levels of self-regulation that should be developed on a representative sample.
Shortened scales have advantages and disadvantages. On one hand, they have a high efficiency of measurement and are more convenient to use, especially in clinical trials, in population studies with long batteries of questions, or with younger respondents (Ziegler et al., 2014). On the other hand, short scales may have lower precision of measurement and have diminished usefulness in studies focused on individual-level decision-making. Also, if the subscale scores are most relevant from the perspective of the research objective, we recommend using the long version of the scale instead.
Supplementary materials are available on the journal’s website.