BACKGROUND
Academic procrastination is a phenomenon that will be familiar to most students and academics. Assignments are neglected until the night before the due date; presentation slides are written on the plane en route to the conference; and long-planned manuscripts about procrastination are left unwritten for months (Lay, 1986).
In terms of formal definitions, to procrastinate is to “voluntarily delay an intended course of action despite expecting to be worse off for the delay” (Steel, 2007, p. 66). Academic procrastination, then, is “to voluntarily delay an intended course of study- related action despite expecting to be worse off for the delay” (Steel & Klingsieck, 2016, p. 37). Academic procrastination is common for at least some types of academic tasks. Glick et al. (2014, Study 1) found that 41% of a sample of 258 undergraduate psychology students in the United States reported that they “al-ways” or “nearly always” procrastinated on writing term papers. Unsurprisingly, academic procrastination appears to be associated with negative academic outcomes: A meta-analysis of 33 studies by Kim and Seo (2015) found a negative (albeit small) weighted mean correlation of –.13 between procrastination and academic performance.
While there are a number of potential antecedents of academic procrastination (see Steel & Klingsieck, 2016), one correlate of particular interest is perfectionism. Perfectionism has been defined as “a multidimensional personality disposition characterized by striving for flawlessness and setting exceedingly high standards of performance accompanied by overly critical evaluations of one’s behavior” (Stoeber, 2017, p. 3). Some authors (e.g., Jadidi et al., 2011; Onwuegbuzie, 2000; Smith et al., 2017) have suggested that there is a positive relationship between perfectionism and procrastination, such that perfectionists are likely to be procrastinators. Burka and Yuen (1983) went so far as to list “I must be perfect” as the very first item in their “Procrastinator’s Code” (a set of assumptions that, they argue, are commonly held by procrastinators). Indeed, there is a conceptual basis to expect a positive relationship: a high level of perfectionism might lead to avoiding or delaying academic tasks rather than submitting work on time (and accepting a degree of imperfection in doing so).
Perfectionism is often measured using the Multidimensional Perfectionism Scale (MPS; Hewitt & Flett, 1991). The MPS divides perfectionism into three components: self-oriented, other-oriented, and socially prescribed. Self-oriented perfectionism comprises “setting exacting standards for oneself and stringently evaluating and censuring one’s own behavior” (Hewitt & Flett, 1991, p. 457). Correspondingly, other-oriented perfectionism comprises setting high standards and stringently evaluating the behaviour of others. Finally, socially prescribed perfectionism pertains to beliefs about the perfectionistic expectations of others: To have a high level of socially prescribed perfectionism is to believe that others set exacting standards for you, and will evaluate you harshly if those standards are not met.
Empirically, the relationship between perfectionism and procrastination seems to differ depending on the dimension of perfectionism examined. A meta-analysis of potential correlates of procrastination was completed by Steel (2007), who drew loosely on the MPS’s division of perfectionism into self-oriented, other-oriented and socially prescribed dimensions. Steel found that socially prescribed perfectionism was positively related to procrastination, mean r_= .18. On the other hand, Steel found that self- and other-oriented perfectionism (treated as a single unidimensional variable) had a near-zero correlation with procrastination, r_ = –.03 (24 studies, N = 3,884).
A subsequent meta-analysis by Sirois et al. (2017) responded to and updated the findings of Steel (2007). Sirois et al. noted that Steel’s treatment of self- and other-oriented perfectionism as a combined single dimension may have obscured the relationships between these different types of perfectionism and procrastination. In performing their meta-analysis, Sirois et al. relied on an alternative model of perfectionism where perfectionism is divided into two higher-order dimensions (Sirois & Molnar, 2016; Stoeber & Otto, 2006). The first dimension is perfectionistic strivings: “the propensity to set excessively high personal standards that are often unrealistic in nature and to demand nothing less than perfection from the self” (Sirois & Molnar, 2016, p. 8). The second is perfectionistic concerns: “extraordinarily critical appraisals of one’s own behavior, chronic harsh self-scrutiny, excessive preoccupations with others’ evaluations, expectations, and criticism” (Sirois & Molnar, 2016, p. 8). In this model, perfectionistic strivings broadly capture the less problematic (or even adaptive) features of perfectionism, while perfectionistic concerns capture the especially maladaptive features of perfectionism. Within their meta-analysis, Sirois et al. (2017) defined the self-oriented perfectionism subscale of the MPS as a measure of perfectionistic strivings, and the socially prescribed perfectionism subscale of the MPS as a measure of perfectionistic concerns. Aggregating information from 43 studies and 10,000 participants, Sirois et al. found a positive correlation, r_ = .23, between procrastination and perfectionistic concerns. On the other hand, they found a negative correlation of r_ = –.22 between procrastination and perfectionistic strivings (38 studies, 9,544 participants).
Another recent meta-analysis of the relationship of perfectionism and procrastination was conducted by Xie et al. (2018), drawing on 21 studies and 14,604 participants. This meta-analysis again found a small negative correlation between procrastination and perfectionistic strivings (r_ = –.14).
SEO (2008)
One study on the relationship between perfectionism and academic procrastination that produced particularly interesting results was that of Seo (2008). Seo conducted a study of 692 students in (South) Korea investigating the relationship between self-oriented perfectionism1 (as measured using the MPS) and academic procrastination (as measured using the Procrastination Assessment Scale – Students; Solomon & Rothblum, 1984). Seo hypothesised that the relationship between self-oriented perfectionism and academic procrastination would be mediated by self-efficacy (as measured using the Korean General Self-Efficacy Scale; Kim & Cha, 1996). Self-efficacy describes “beliefs in one’s capabilities to mobilize the motivation, cognitive resources, and courses of action needed to meet given situational demands” (Wood & Bandura, 1989, p. 408). Seo’s hypothesised mediation model implies that self-oriented perfectionism affects self-efficacy, and that self-efficacy goes on to affect academic procrastination. Seo specified the second part of this hypothesis based on the theory that students with greater levels of self-efficacy would engage more deeply and persistently with academic tasks (thus producing a negative effect of self-efficacy on procrastination). Seo did not provide an explicit rationale for the implied hypothesis that self-oriented perfectionism would affect self-efficacy, but it is plausible that setting oneself high standards might have a positive effect on self-efficacy – at least for individuals who meet their own high standards reasonably frequently.
Seo’s main analysis was a structural equation model. The parameter estimates from this structural equation model indicated that self-oriented perfectionism had a positive and statistically significant relationship with self-efficacy (standardised b' = .65), which in turn had a negative and statistically significant relationship with academic procrastination (standardised b' = –.71). She also reported that self-efficacy completely mediated the effect of self-oriented perfectionism on academic procrastination, given that an alternative model with a direct effect of self-oriented perfectionism on academic procrastination did not fit significantly better than one without this direct effect included. Although Seo did not report a total effect for self-oriented perfectionism on academic procrastination, the absence of a direct effect in her model means that the standardised total effect can be calculated simply as .65 × –.71 = –.46. This suggests a strong negative relationship between self-oriented perfectionism and academic procrastination.
RATIONALE FOR CONCEPTUAL REPLICATION
Within psychology there has been a growing recognition in recent years that a substantial proportion of published findings may not be replicable. For example, an attempt by the Open Science Collaboration (2015) to replicate 100 published psychological studies was able to successfully reproduce the original findings for only approximately a third of studies (de-pending somewhat on how replication success was defined). Similarly, an attempt by Klein et al. (2018) to replicate 28 classic and contemporary psychological studies was able to reproduce the original findings for only about half of the studies. Problems such as these have led to calls for researchers to more frequently conduct rigorous replication studies, rather than simply taking the replicability of published findings for granted (see Brandt et al., 2014; Zwaan et al., 2018).
Seo’s study is one that seems to be worth replicating on several counts. First, her finding of a strong negative relationship between self-oriented perfectionism and academic procrastination is somewhat inconsistent with other findings in the literature. Specifically, in contrast to Seo, Steel’s (2007) meta-analysis found no evidence of a correlation between self- and other-oriented perfectionism and procrastination. Sirois et al.’s (2017) meta-analysis did find a negative relationship between perfectionistic strivings and procrastination, but of much smaller size (r _ = –.22) than the standardised total effect of –.46 implied by Seo’s model. Considering the Korean population in specific, a recent survey (Kim et al., 2020) even found a small positive correlation (r = .09-.10) between clinical perfectionism and two measures of procrastination. This said, a study of Korean 7th graders by Bong et al. (2014) produced findings more similar to Seo’s, with a negative total effect of self-oriented perfectionism on academic procrastination, and evidence for mediation by self-efficacy.
Second, like almost all studies in its time, Seo’s study was not preregistered. Preregistration is the practice of prespecifying plans for data collection and analysis in an online repository (see Nosek et al., 2018). It has gained popularity in psychology in recent years as a strategy for dealing with the problem that flexibility in data collection and analysis can allow researchers to easily produce statistically significant findings even in the absence of true relationships (see Simmons et al., 2011).
Third, Seo’s study has had a relatively substantial degree of influence in the literature (Google Scholar lists 192 citations as at 2 August 2021).
Finally, Seo’s findings are important for practice in education and psychology. Self-help resources targeted at combating procrastination often suggest that reducing one’s level of perfectionism is a useful way to limit procrastination (e.g., Drillinger, 2019; Jacobs, 2014; Knaus, 2010). Indeed, this suggestion can even be found in the academic literature, albeit typically presented in more nuanced terms (e.g., Flett et al., 2004; Foster, 2007). In contrast, the fact that Seo’s structural equation model implies a strongly negative (albeit indirect) effect of perfectionism on procrastination implies that reducing perfectionism could be an actively counterproductive strategy for reducing academic procrastination.
Given these considerations, the “replication value” of Seo’s study (2008) – that is, the extent to which a replication would be worthwhile – appears to be high (see Nosek et al., 2012, p. 622).
AIMS AND HYPOTHESES
In the current study, we aimed to test the validity of hypotheses based on Seo’s major findings in a preregistered study with a more diverse sample of participants drawn from a range of countries. In doing so we applied different (albeit similar) measures and data analyses. In other words, our study forms a conceptual replication rather than a “direct” or “exact” replication. Conceptual replications are useful for increasing confidence in hypotheses – rather than focusing only on the reproducibility of results produced by the specific methods and operation-alisations applied in an original study (see Crandall & Sherman, 2016). A finding of support for a hypothesis across different methods and operationalisations of variables can increase the scientific community’s confidence in that hypothesis.
We based our hypotheses for our study on Seo’s two major findings. She stated these findings as follows: “The first major finding was that self-efficacy completely mediates the relationship between self-oriented perfectionism and academic procrastination” (Seo, 2008, p. 760); “The second major finding of our study was that self-oriented perfectionism often leads to less academic procrastination” (Seo, 2008, p. 761). Our preregistered hypotheses restated these claims in clear falsifiable terms, taking into account the directions of relationships reported in Seo’s results section:
There is a positive bivariate relationship between self-oriented perfectionism and self-efficacy.
There is a negative bivariate relationship between self-oriented perfectionism and academic procrastination.
There is a negative bivariate relationship between self-efficacy and academic procrastination.
There is a negative indirect effect of self-oriented perfectionism on academic procrastination (via an effect of self-oriented perfectionism on self-efficacy).
When controlling for the effect of self-efficacy, there is no direct effect of self-oriented perfectionism on academic procrastination (i.e., the relationship between self-oriented perfectionism and academic procrastination is completely mediated by self-efficacy).
In addition, our preregistration included an ancillary hypothesis and research question that were specified for pedagogical purposes. See the Supporting Information file on our Open Science Framework (OSF) project at https://osf.io/m5dy6/ for this hypothesis and research question, and the results of analyses investigating them.
PARTICIPANTS AND PROCEDURE
DESIGN AND POWER
This study used a cross-sectional survey design. To determine the appropriate sample size, a power analysis was conducted with respect to the regression model to be used to test hypothesis 5 (H5: no direct effect of self-oriented perfectionism on academic procrastination when controlling for self-efficacy). It was important that this analysis be well powered to detect even a small direct effect of self-oriented perfectionism, given that such an effect would refute H5. Adequately powering the study for the analysis pertaining to H5 also ensured adequate power to detect bivariate relationships (H1-H3), and to detect an indirect effect (H4), provided this indirect effect was not very small.
A preregistered power analysis was thus conducted for a significance test for a single coefficient within a multiple regression model with two predictors, with a small effect size of Cohen’s f2 = 0.02. This suggested that a sample size of 528 was required to achieve power of 90% with a 2-tailed test and an α level of .05. While the required sample size implied by this power analysis was smaller than Seo’s (2008) sample size of 692, the sample size in the original study was large: to the extent that the original study had significant limitations, sample size was not one of them.
PARTICIPANTS AND PROCEDURE
Participants were a convenience sample recruited via Prolific (prolific.co), a platform where participants are paid to participate in research. Pre-screening criteria were set using Prolific such that only current full-time students and part-time students (whether at tertiary or secondary level) could participate. Participants also needed to have a 95% approval rate from prior studies2. Each participant was paid a small reward of 0.85 British pounds. Participants were provided with a detailed information sheet, and the survey began with a question asking for their consent to participate.
At the time of data collection, Prolific permitted participation from all OECD countries except Turkey. We considered it useful to recruit participants from a wide range of countries to improve the generalis-ability of our findings. However, the use of Prolific (an English-language platform) helped to ensure that participants were sufficiently fluent in English to understand the survey. On the other hand, truly global recruitment would have required surveys in many different languages.
A target sample size of 584 was specified in Prolific, which allowed for the possibility of close to3 10% of responses needing to be removed (after the application of exclusion criteria) while still achieving the target sample size of 528. The original number of responses collected in Qualtrics was 623, largely due to the presence of some participants who started the study and then were determined to be ineligible (and thus did not count towards the target sample size). The preregistered exclusion criteria are summarised below (see the preregistration for the full criteria).
Not answering “Yes” to the consent question (no exclusions).
Being under 18 years of age (2 exclusions).
Not being a current student (27 further exclusions).
Responding to fewer than 75% of the items of the 25 items in the three main study scales (7 further exclusions).
Being identified as a response with a status of “preview”, “test”, or possible spam/duplicate responses by Qualtrics (no further exclusions).
Giving an incorrect or missing response to an attention check reading “Please demonstrate that you are paying attention by ticking ‘5 – strongly agree’ to this item” (12 further exclusions).
Being a duplicate response from the same Prolific worker (as indicated by a matching Prolific ID; no further exclusions).
After applying the exclusion criteria, the final sample size was N = 575, which exceeded the target sample size. Within the final sample there was just one missing response to a study item, which was imputed using expectation-maximisation imputation (as preregistered).
Most participants resided in the United States (32.7%) or the United Kingdom (19.7%). More information about the distribution of participants across countries can be found in the Supporting Information file on our OSF project at https://osf.io/m5dy6/. The demographic characteristics of the sample are described in Table 1.
Table 1
Demographic characteristics of sample
MEASURES
Academic procrastination. Academic procrastination was measured using adapted parts of Solomon and Rothblum’s (1984) Procrastination Assessment Scale – Students (PASS). This scale was also used in Seo’s study (2008).
The original PASS has two major sections (areas of procrastination and reasons for procrastination). The first section contains questions about six different academic areas: “writing a term paper”, “studying for exams”, “keeping up with weekly reading assignments”, “academic administrative tasks: filling out forms, registering for classes, getting ID card”, “attendance tasks: meeting with your advisor, making an appointment with a professor” and “school activities in general”. For each area of academic functioning, participants are asked to indicate the degree to which they procrastinate in this area (e.g., “To what degree do you procrastinate on studying for tests or exams?”), the degree to which this procrastination is a problem, and the extent to which they would like to reduce their tendency to procrastinate in this area. The second section contains questions about reasons for procrastination. This section of the scale was not used by Seo (2008) and was therefore not included in this study.
The PASS was also adapted for the current study to improve its relevance to modern students. First, questions covering the two areas “attendance tasks: meeting with your advisor, making an appointment with a professor” and “academic administrative tasks: filling out forms, registering for classes, getting ID card” were omitted, since some of these tasks are no longer common (or largely automated) for many students. Second, some of the remaining items were modified to be clearer and more inclusive for an international audience; for example, “writing a term paper” was modified to “writing term papers or assignments”. Further details regarding these modifications can be found in our preregistration.
The adapted PASS used in this study had 12 items in total. Each participant’s responses were summed to obtain a total academic procrastination score with a possible range of 12-60. Responses to the adapted PASS in the current study demonstrated relatively strong internal consistency reliability, Cronbach’s α = .89.
Self-oriented perfectionism. Self-oriented perfectionism was measured using the 5-item self-oriented perfectionism subscale of the Big Three Perfectionism Scale (BTPS; Smith et al., 2016). In contrast, Seo (2008) measured self-oriented perfectionism using the self-oriented perfectionism subscale of the Multidimensional Perfectionism Scale (Hewitt & Flett, 1991). However, the MPS was not used in this study due to its copyright restrictions, which are problematic from an open science perspective (the materials from this study are available on our OSF project page at https://osf.io/m5dy6/. Smith et al. (2016) reported that responses to the self-oriented subscale of the BTPS displayed strong internal consistency (α = .89, Study 2), and displayed substantial positive relationships with conceptually related perfectionism dimensions (Study 2). Responses to the self-oriented subscale of the BTPS likewise displayed strong internal consistency in the current study, α = .90, and were summed to obtain a self-oriented perfectionism score with a possible range of 5-25.
Self-efficacy. Self-efficacy was measured using the New General Self-Efficacy Scale (NGSE; Chen et al., 2001b). Seo (2008) used the Korean General Self Efficacy Scale, which was not suitable for this research given that the participants were generally not speakers of Korean. The NGSE was selected for this study given its evidence of strong reliability and construct validity (Chen et al., 2001b; Scherbaum et al., 2006), its brief nature, and its relatively permissive copyright restrictions (see Chen et al., 2001a). Responses to this measure displayed relatively strong internal consistency in the current study, α = .89. Item responses were summed to obtain a self-efficacy score with a possible range of 8-40.
PILOT/PRETESTING
A “pilot” study with 10 participants was completed to check for survey usability issues. The pilot participants were not eligible to take part in the main study, and their data are not included in the study as described here. No changes were made based on this pilot.
ANALYSES
Two main sets of preregistered analyses were conducted. The first set of analyses consisted of ordinary least squares (OLS) regression analyses in which the variables self-oriented perfectionism, self-efficacy, and academic procrastination were treated as observed. The second set of analyses treated these variables as latent (using structural equation modelling), allowing for the effects of measurement error to be explicitly modelled and accounted for. While the latter set of analyses more closely aligns with Seo’s (2008) original analyses, the inclusion of both sets allowed us to examine how well Seo’s findings replicated across two reasonable alternative ways of testing the hypotheses (for a demonstration of the importance of such checks, see Silberzahn et al., 2018).
In Seo’s analyses, item “parcels” (summed responses to sets of items) were used as latent variable indicators in her SEM models. The current study did not use item parcels as indicators of the self-oriented perfectionism and self-efficacy latent variables, because the number of items for each of these latent variables was already low. There was also little a priori reason to assume that the parcels used by Seo are unidimensional, as assumed when applying item parcelling (Kim & Hagtvet, 2003). However, item parcelling was used in this study for the indicators of the 12-item adapted PASS. The adapted PASS asked participants the same three questions about procrastination in each of four academic areas. If the individual items had been entered as observed variables there would thus have been a need to specify correlated error terms across the four items using the same wording (for different activities) and across the three items asked about each activity, potentially resulting in a large number of correlated error terms. Using item parcelling allowed for a more parsimonious specification.
The data were analysed in R (R Core Team, 2018) with SEM analyses using the lavaan package (Rosseel, 2012). Diagonally weighted least squares was the estimation method selected for SEM, with robust standard errors and a Satorra-Bentler scaled test statistic (“WLSM” estimation). This method helped to account for the fact that the data were collected using discrete rating scale items and thus were not drawn from a multivariate normal distribution. Scaling of the variance of latent variables was accomplished by setting the factor loading of the first indicator of each latent variable to 1.
A preregistration is available at https://osf.io/xfvd8, while a de-identified copy of the data, the R script, and exported survey are available at https://osf.io/m5dy6/. The analysis script for this study formed part of the preregistration prior to data collection, with minor revisions (highlighted with comments) after data collection.
ETHICS APPROVAL
This study was evaluated by peer review and determined to be low risk. A low risk notification (similar to “exempt review” in North America) was submitted to the Massey University human ethics committee. The research was conducted in accordance with the provisions of the Declaration of Helsinki.
META-THEORETICAL STANCE
This study is informed by a realist stance with respect to ontology and epistemology (see Haig & Evers, 2015); i.e., we presuppose that an external reality exists (and scientific theories attempt to describe that reality), while acknowledging the impossibility of verifying with certainty any (synthetic) claims about this reality. This realist stance is reflected in our use of a structural equation model with latent variables (see Borsboom et al., 2003). Using this model, we attempt to draw probabilistic inferences about psychological attributes which are not directly observed, but that are presumed to exist and exert causal effects.
RESULTS
The means, standard deviations, and Cronbach’s α estimates for academic procrastination, self-oriented perfectionism, and self-efficacy are shown in Table 2.
Table 2
Descriptive statistics
| Variables | M | SD | Possible range |
|---|---|---|---|
| Academic | 42.05 | 9.02 | 12-60 |
| procrastination (PASS) | |||
| Self-oriented | 15.39 | 4.99 | 5-25 |
| perfectionism (SOP) | |||
| Self-efficacy (NGSE) | 30.67 | 5.55 | 8-40 |
REGRESSION ANALYSES
As per the preregistration, simple linear regression models were used to test hypotheses 1 to 3. Hypothesis 1 was supported, with a positive bivariate relationship between self-oriented perfectionism and self-efficacy, b = .22, 95% CI [.13, .31], p < .001, r = .20. Hypothesis 2 was not supported: the relationship between self-oriented perfectionism and academic procrastination was slightly negative but not statistically significant, b = –.05, 95% CI [–.20, .10], p = .533, r = –.03. Hypothesis 3 was supported, with a negative bivariate relationship between self-efficacy and academic procrastination, b = –.32, 95% CI [–.45, –.19], p < .001, r = –.20.
Hypotheses 4 and 5 were tested using a mediation model, with confidence intervals estimated via nonparametric bootstrapping with 1000 simulations, as specified in the pre-registration. Specifically, bias-corrected and accelerated (BCa) bootstraps were computed. Hypothesis 4 was that there is a negative indirect effect of self-oriented perfectionism on academic procrastination (via an effect of self-oriented perfectionism on self-efficacy). The results of the regression analyses supported hypothesis 4, with an unstandardised indirect effect of ab = –.07, 95% CI [–.12, –.03], p < .001, standardised ab' = .04.
Hypothesis 5 stated that, when controlling for the effect of self-efficacy, there would be no direct effect of self-oriented perfectionism on academic procrastination (i.e., the relationship between self-oriented perfectionism and academic procrastination is completely mediated by self-efficacy). As specified on the pre-registration, this hypothesis would be considered supported if the p value for the direct effect was not statistically significant (i.e., p > .05, 2-tailed) and the lower and upper limits of a 90% bootstrapped confidence interval for the stan-dardised direct effect both fell within the range –0.1 to 0.1. The range –0.1 to 0.1 was selected to denote an effect practically equivalent to zero (i.e., a “negligible” effect) given that standardised regression coefficients are similar to correlation coefficients in scale; Cohen (1988) defined a correlation of 0.1 as “small” (p. 79). Comparing a 90% confidence interval to these equivalence bounds effectively produces an equivalence test where the risk of falsely concluding that the true effect is between –0.1 and 0.1 is no higher than 5% if the true standardised effect is 0.1 or greater in absolute value (see Lakens et al., 2018). The analysis produced a standardised direct effect of .01, 90% bootstrapped CI [–.06, .08], p = .770, supporting hypothesis 5.
STRUCTURAL EQUATION MODEL ANALYSES
A structural equation model (SEM) was also used to test hypotheses 1 to 5, where self-oriented perfectionism, self-efficacy and academic procrastination were all treated as latent variables (see Figure 1).
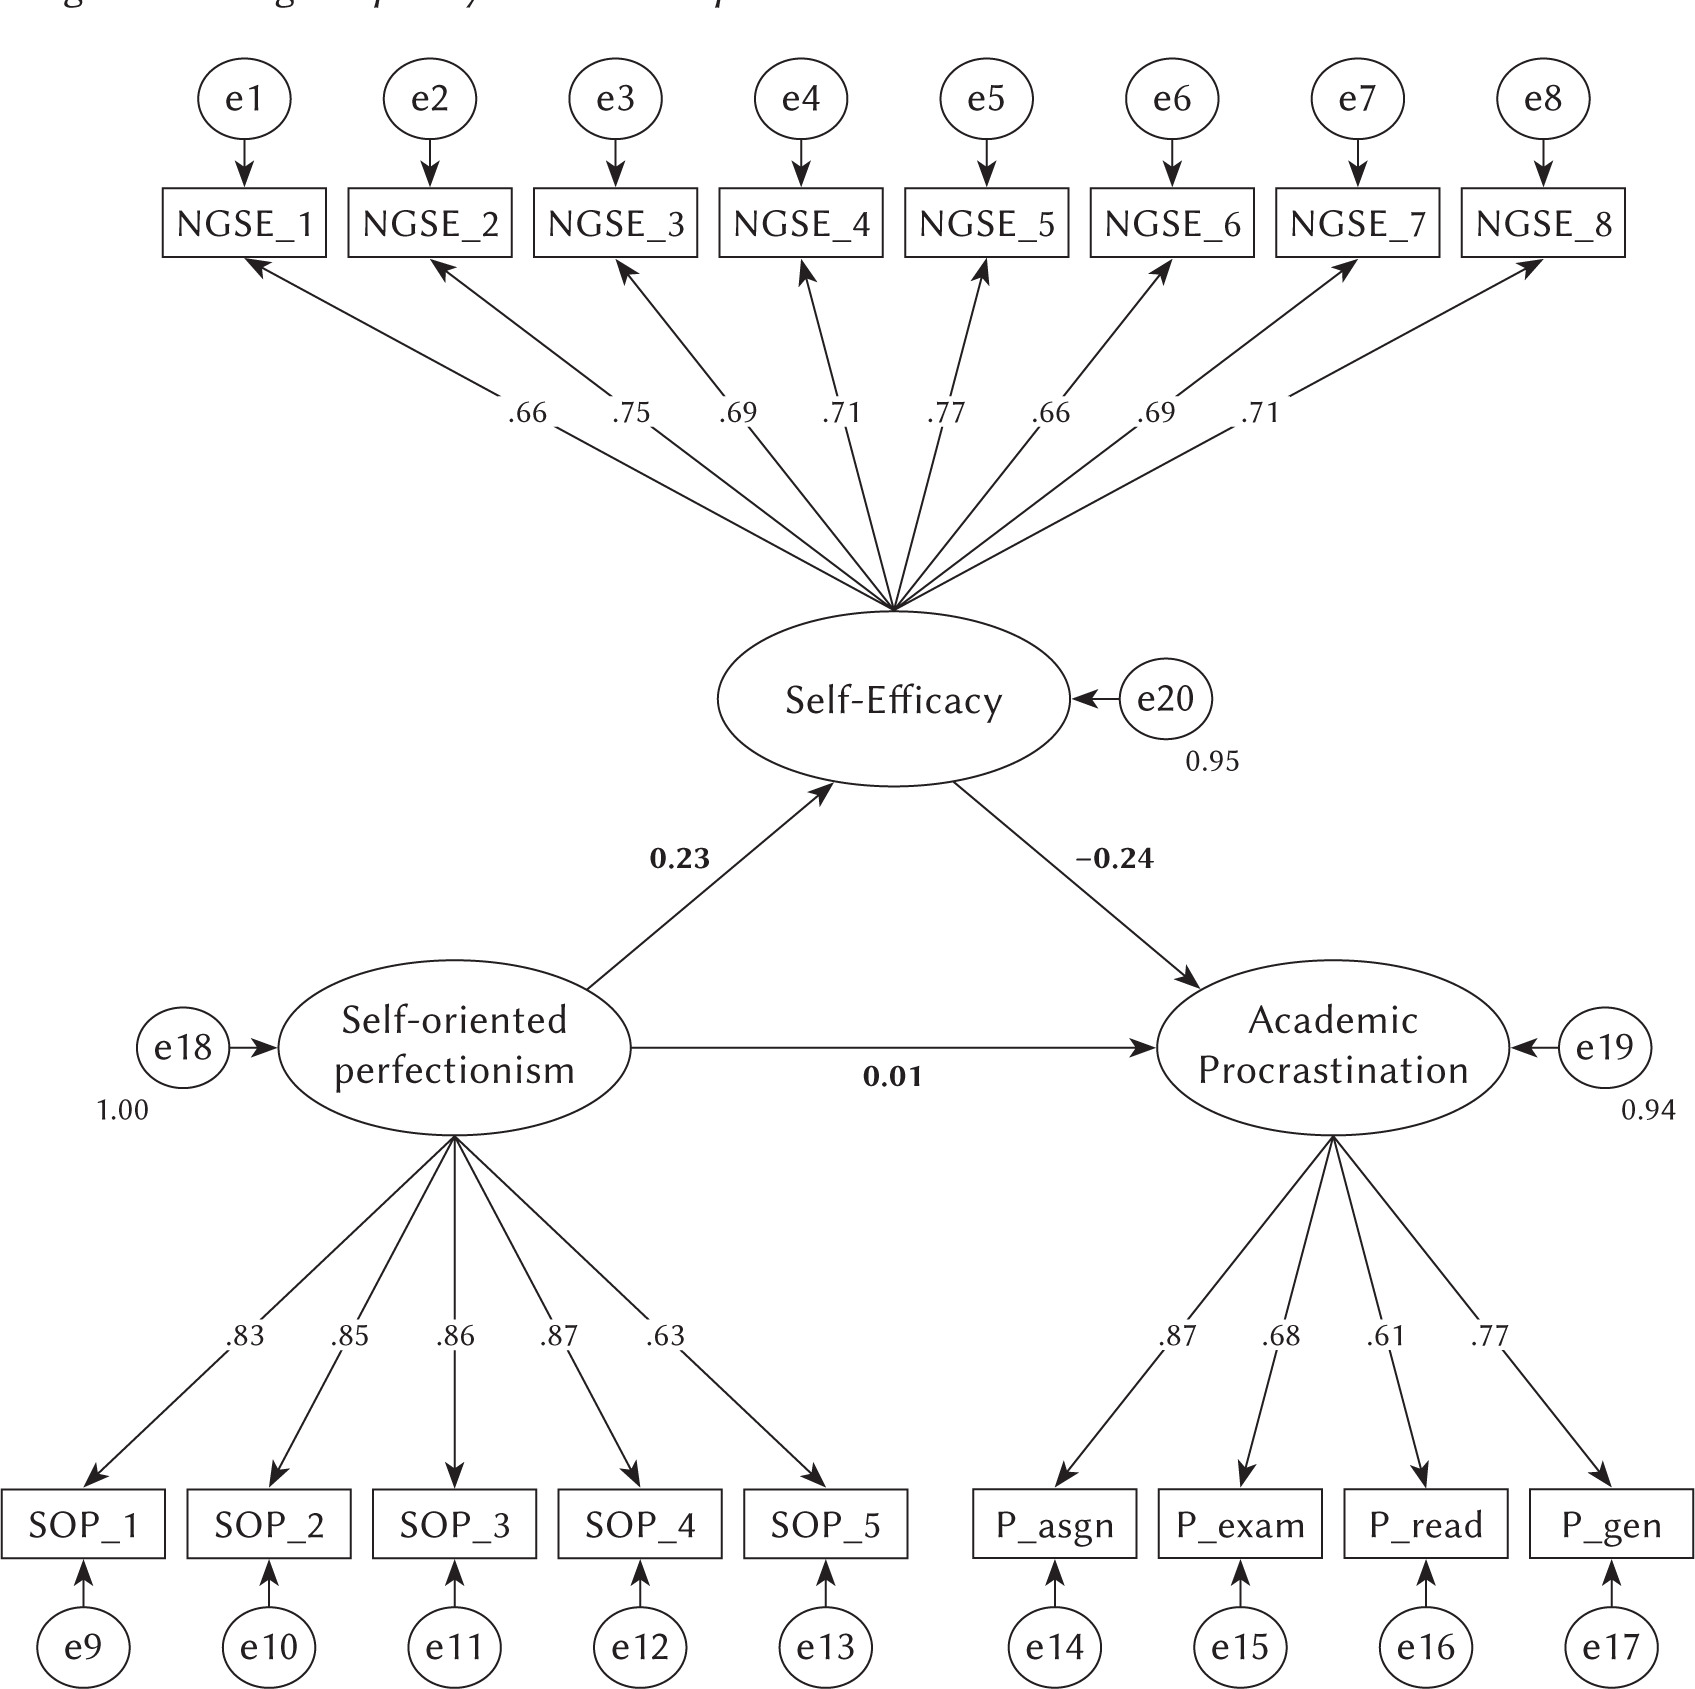
Hypothesis 1 was supported in the SEM analysis: the effect of self-oriented perfectionism on self-efficacy was positive and statistically significant (standardised regression path b' =. 23, 95% CI [.13, .33], p < .001). Hypothesis 2, however, was not supported: the total effect of self-oriented perfectionism on academic procrastination was not statistically significant, standardised total effect = –.04, 95% CI [–.13, .05], p = .337. Hypothesis 3 was supported, with a significant and negative relationship between self-efficacy and academic procrastination, b' = –.24, 95% CI [–.34, –.15], p < .001. Hypothesis 4 was also supported, with a negative and significant indirect effect of self-oriented perfectionism on academic procrastination, standardised indirect effect ab' = –.06, 95% CI [–.09, –.02], p = .001. That said, this effect was much smaller than the standardised indirect effect of .65 × –.71 = –.46 reported by Seo (2008).
Finally, hypothesis 5 was supported by the analyses: the standardised direct effect of self-oriented perfectionism on academic procrastination was not statistically significant, b' =. 01, p = .820, and its 90% confidence interval again fell within the preregistered equivalence bounds of –0.1 to 0.1, 90% CI [–.07, .09].
The preregistration indicated that global fit of the structural equation model would be tested using the Satorra-Bentler chi-square statistic (which is scaled for non-normality), the root mean square error of approximation (RMSEA), and the standardised root mean square residual (SRMR). The preregistration did not specify whether the RMSEA would be scaled for non-normality, but we report the scaled version here for consistency with the SBχ2 calculation. The SatorraBentler chi-square statistic, SBχ2(116) = 430.8, p < .001, indicated that the null hypothesis of exact fit of the model in the population could be rejected. The RMSEA of 0.07 was greater than the preregistered threshold of 0.06 for good fit, suggesting that the quantity of error in the approximation of the sample covariance matrix was substantial. However, the robust SRMR estimate 0.05 (being less than the preregistered threshold for good fit of 0.08) indicated only a small difference between the sample correlation matrix and that implied by the model. As indicated in the preregistration, these fit statistics were not used to test the validity of the hypotheses themselves, but they do indicate that the fit of the model to the sample covariance matrix was less than perfect. This possible misspecification in turn means that some of the parameter estimates may have been biased, implying the presence of additional uncertainty around the estimates of direct and indirect effects (and other parameters).
OMEGA/COMPOSITE SCALE RELIABILITY
While we reported Cronbach’s α as an estimate of reliability for each scale in the method section, alpha relies on the assumption of tau equivalence (i.e., that, for a set of items intended to measure a single factor, the loadings are all identical). An alternative estimator of reliability that does not assume tau equivalence is McDonald’s ω (McDonald, 1999). Omega can be defined and calculated in several different ways. One estimate that can be calculated for a set of p items loading on a single common factor (scaled to have a factor variance of 1) is
where
EXPLORATORY ANALYSIS: NON-LINEARITY
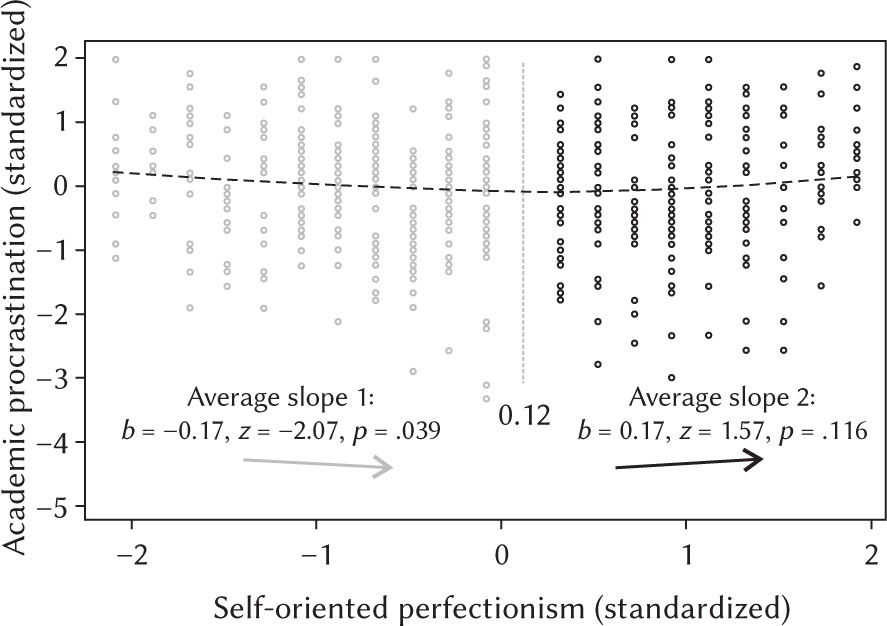
The analyses reported thus far assume purely linear relationships between variables (as did the analyses reported by Seo). However, the true relationships may not in fact be linear. This is particularly plausible for the key relationship in the study (between self-oriented perfectionism and academic procrastination). It might be, for example, that moderate perfectionism is associated with a low level of procrastination, while very low levels or high levels of perfectionism are associated with higher levels of procrastination (given that too little perfectionism may result in low motivation to produce work, while too much perfectionism might result in an inability to stop working and submit a finished product). We therefore conducted an additional exploratory (nonpreregistered) analysis where we examined whether there is evidence of non-linearity in the relationship between the two key variables of self-oriented perfectionism and academic procrastination.
To test for the presence of U-shaped (or inverted U-shaped) relationships, Simonsohn (2018) developed a “two lines” test. In the two lines test, a regression line is broken into two linear components (with a break point that is automatically identified using a “Robin Hood” algorithm). When this test provides two regression slopes of different signs, both statistically significant, this comprises evidence of a U-shaped (or reverse U-shaped) relationship. In the current study, the two lines analysis identified a break point of z = +.12 (i.e., a change in slope when self-oriented perfectionism reaches a slightly above-average point). The slope was positive and significant below this point, b' = –.17, p = .039, and negative but not significant above this point, b' = .17, p = .116 (see Figure 2). This result is mildly suggestive of a U-shaped relationship but does not provide strong evidence for it (given that the second slope was not statistically significant, and the first only barely so). Overall, this analysis of non-linearity provides equivocal results, although it does not rule out the presence of non-linearity.
DISCUSSION
The present study aimed to conceptually replicate Seo’s (2008) study of self-oriented perfectionism, self-efficacy, and academic procrastination. Five hypotheses were specified based on Seo’s study, those hypotheses encapsulating her key findings: a negative relationship between self-oriented perfectionism and academic procrastination, with this relationship being completely mediated by self-efficacy.
In our study, we tested the hypotheses using both OLS regression models (treating the variables as observed) and SEM analyses (treating the variables as measured with error). These analyses provided different quantitative estimates of the relevant relationships but were fully consistent in terms of which hypotheses were supported and which not supported. Our results supported hypothesis 1 (that there is a positive bivariate relationship between self-oriented perfectionism and self-efficacy), hypothesis 3 (that there is a negative bivariate relationship between self-efficacy and academic procrastination), and hypothesis 4 (that there is a negative indirect effect of self-oriented perfectionism on academic procrastination via an effect of self-oriented perfectionism on self-efficacy). They also supported hypothesis 5 (that, after controlling for self-efficacy, there is no direct effect of self-oriented perfectionism on academic procrastination).
While the fact that four of our five hypotheses were supported might suggest that our replication was largely successful, hypothesis 2 (that there is a negative bivariate relationship between self-oriented perfectionism and academic procrastination) was not supported by our analyses. This hypothesis was arguably the most crucial in this replication. Our finding in this regard is quite markedly divergent from Seo’s result, which (as discussed above) implies a strong negative relationship between self-oriented perfectionism and academic procrastination of approximately r = –.46. Our finding is more consistent with an earlier meta-analysis (Steel, 2007) which found no evidence of a relationship between perfectionism and procrastination. It is less consistent, however, with a more recent meta-analysis (Sirois et al., 2017) which found a moderate negative relationship between perfectionistic strivings and procrastination.
The fact that we found no evidence of a total effect (i.e., a relationship between self-oriented perfectionism as the independent variable and academic procrastination as the dependent variable) has implications for the results of our mediation analysis. Interestingly, we did find evidence of the hypothesised indirect effect of self-oriented perfectionism on academic procrastination via self-efficacy, although the size of this effect was small. This finding partly reflects the fact that the estimate of the direct effect was slightly positive (though not significant) and the indirect effect slightly negative; the sum of these two effects as the total effect was thus closer to zero than the indirect effect, and not significant. Zhao et al. (2010) describe this scenario of direct and indirect effects of opposite sign as “competitive mediation” (p. 199). In terms of whether this pattern of findings reflects the true underlying causal effects, it is possible that self-oriented perfectionism might have a negative indirect causal effect on academic procrastination that is exactly balanced by a positive direct causal effect (resulting in no total effect whatsoever). However, it is also entirely possible that the unusual combination of a significant indirect and non-significant total effect reflects sampling error, sampling bias, or residual confounding.
One aspect of hypothesis 5 merits further discussion. In our preregistration, we described this hypothesis as follows: “H5: When controlling for the effect of self-efficacy, there is no direct effect of self-oriented perfectionism on academic procrastination (i.e., the relationship between self-oriented perfectionism and academic procrastination is completely mediated by self-efficacy)”. Our unexpected pattern of results means that while hypothesis 5 is supported according to our inferential criteria, it would be somewhat misleading to claim that there was empirical support for the parenthetical part of the hypothesis (that “the relationship between self-oriented perfectionism and academic procrastination is completely mediated by self-efficacy”). That part of the hypothesis implicitly assumes the existence of a relationship between self-oriented perfectionism and academic procrastination to be mediated, and we found no evidence of such a relationship.
The lack of evidence for a relationship between self-oriented perfectionism and academic procrastination in this study is substantively interesting. One possible explanation for this finding is that self-oriented perfectionism could exert both positive and negative effects on procrastination; i.e., holding oneself to high standards might increase one’s motivation to complete academic work in a timely fashion, but also make it more difficult to submit work (and to accept imperfections in doing so). Such effects could counterbalance each other, producing a net zero effect. This explanation is obviously speculative, but could be empirically tested.
STRENGTHS AND LIMITATIONS
Our study had some strengths as a replication, most notably the fact that it was comprehensively preregistered (including a preregistered R script for data processing and analysis), limiting the possibility of undisclosed data-dependent analysis decisions (see Gelman & Loken, 2014; Simmons et al., 2011). Our analysis and reporting also included some improvements over Seo’s study (e.g., the fact that we reported indirect and total effects along with confidence intervals and significance tests). However, our study nevertheless constituted a conceptual rather than direct replication: We used different measures (in a different language), drew our sample from a different population, and applied different (albeit similar) data analyses. This means that we cannot determine whether our discrepant findings reflect these differences or indicate that Seo’s findings represent erroneous inferences (e.g., Type I errors).
Cultural differences between the two samples are certainly one plausible contributor to the differing findings, given that the original study was conducted in Korea while this replication was conducted with an English-speaking sample from OECD countries. Korea is known for a highly demanding academic culture (Ahn & Baek, 2013; Park & Kim, 2006). We can speculate that within this demanding academic culture perfectionism is likely to be prized by many, while procrastination is not. As such, sheer individual variability in adherence to cultural norms (or even variation in social desirability bias) could induce a negative correlation between perfectionism and procrastination in the Korean population. Indeed, the fact that Bong et al. (2014) also found a substantial negative correlation (r = .37) between self-oriented perfectionism and academic procrastination in Korean 7th graders speaks in favour of the idea that there may be a negative relationship between these two variables in the Korean population – even if this negative relationship does not necessarily hold in other countries or cultures.
Another limitation of our replication was the fact that our study had a slightly smaller sample size than Seo’s. That said, this represented the outcome of a deliberate and considered decision based on a power analysis which suggested the planned sample size would be sufficient.
There are also some significant limitations that apply to both Seo’s original study and our replication. First, both studies used convenience samples (albeit collected via different methods); as such, substantial uncertainty remains with respect to the extent to which the findings of each study apply to its respective population. Second, as studies testing mediation models, both are concerned with the drawing of causal inferences (e.g., Seo, 2008, p. 761: “That is, self-oriented perfectionism was found to have a positive influence on self-efficacy”). However, both studies used purely correlational cross-sectional designs without any experimental manipulation, longitudinal element, or statistical controls for plausible confounding variables (see Maxwell et al., 2011; O’Laughlin et al., 2018). This means that we can only draw extremely tentative causal inferences from these studies; it is possible that the relationships observed are due to residual confounding, or even that effects exist in different directions to those hypothesised (e.g., self-efficacy might very plausibly have an effect on self-oriented perfectionism). Third, both studies examined only self-oriented perfectionism, rather than evaluating other dimensions of perfectionism such as socially prescribed perfectionism or perfectionistic concerns (see Frost et al., 1990). Finally, both studies relied purely on self-report measurements, and did not examine the extent to which variation in procrastination levels went on to affect learning outcomes (e.g., academic performance; see Kim & Seo, 2015).
DIRECTIONS FOR FUTURE RESEARCH
One important direction for future research in this area will be to use causal identification strategies to provide more informative tests of hypotheses about causal effects. For example, it may be possible to experimentally manipulate perfectionism levels (e.g., Rozental et al., 2017) and thereby test downstream effects on variables such as procrastination. Alternatively, careful specification of plausible confounding and collider variables in a graphical causal model may permit the estimation of causal effects using observational data (see Rohrer, 2018).
Another important direction for future research stems from our supplementary exploratory analysis of possible non-linearity in the relationship between self-oriented perfectionism and academic procrastination. Our findings with respect to this question were somewhat tentative, with some equivocal evidence of a U-shaped relationship. It may be useful for future research to take a confirmatory approach to this question, with a preregistered method for testing the hypothesis of a U-shaped relationship (e.g., the two lines approach of Simonsohn, 2018), with a sample size planned in order to deliver adequate power for this approach.
IMPLICATION FOR PRACTICE
This study was not focused on testing an intervention and, as acknowledged above, does not form a strong basis for the drawing of causal inferences. However, the fact that we found no evidence of a relationship between self-oriented perfectionism and academic procrastination suggests that reducing students’ level of perfectionism with respect to their own academic work is unlikely to be an effective general strategy for combating academic procrastination. For more promising interventions for addressing procrastination, see Schouwenburg et al. (2004).
CONCLUSIONS
We found no evidence of a relationship between self-oriented perfectionism and academic procrastination, meaning that we were unable to reproduce one of Seo’s (2008) two key findings. We nevertheless did find evidence of a small, negative, and indirect effect of self-oriented perfectionism on academic procrastination via an effect on self-efficacy.