BACKGROUND
Zigler’s (1999, 2001) theory assumes that people with intellectual disability are more prone to developing specific personality traits which may hinder their functioning. The importance of this theory lies in its attempt to explain the behavior of people with intellectual disability by addressing psychological constructs that are not directly linked to limited cognitive abilities (Burack et al., 2021a; Evans et al., 2023). Specific personality traits are presumed to emerge in the course of interactions with the environment when a person experiences social neglect or repeatedly faces situations that are overly demanding (Burack et al., 2021b). The term “specific personality trait” in this theory refers to individual differences related to motivation, social interactions, and attitudes towards performance in cognitive tasks (Zigler, 1999; Zigler et al., 2002).
The studies in which Zigler and colleagues assessed specific personality traits typically compared the performance of people with intellectual disability to controls from the general population, but they differed in particular elements of study design. Zigler and Balla (1972) studied positive- and negative-reaction tendencies. The authors compared the performance of 39 people with intellectual disability and 39 younger children matched for mental age. In this study, the authors excluded participants with combined intellectual disability and emotional problems, and they did not include participants of a similar chronological age. In a study of outerdirectedness, Yando and Zigler (1971) included 96 children with intellectual disability and 96 controls. The authors formed small subgroups differentiating participants who were institutionalized and non-institutionalized and also those with different etiologies of intellectual disability. The authors included control groups matched for mental age and chronological age, but in each of the subgroups only 12 people were assigned to the experimental condition, and the same number was assigned to the control condition. Harter and Zigler (1974) studied four different aspects of effectance motivation: variation seeking, curiosity, mastery for the sake of competence, and preference for challenging tasks. The authors assessed institutionalized and noninstitutionalized children with intellectual disability, excluding children with combined disabilities and emotional problems. They assigned 31 participants to a low-functioning group with intellectual disability, and 34 children to a high-functioning group with intellectual disability. The controls were younger children of average intellectual functioning matched on mental age. No controls of similar chronological age were introduced. Finally, in another study Zigler et al. (2002) used a set of tasks from previous studies as an indicator of the validity of their newly developed questionnaire to assess specific personality traits. The authors described the group as composed of 60 students, but no information on the exact age of participants or their IQ was provided. It was reported that the scores in the tasks correlated with the scales of the questionnaire. However, considering the issues regarding the factorial structure of the questionnaire (see Gacek et al., 2022), these results are difficult to interpret.
In our study we aimed to conceptually replicate studies conducted by Zigler and colleagues regarding specific personality traits. We hypothesized that the levels of specific personality traits of people with intellectual disability would differ from those of controls from the general population; we also hypothesized that the direction of differences in regard to these specific personality traits would be the same as assumed in Zigler’s theory. We decided to study adolescents and young adults with intellectual disability because we assume that in this group the cumulative effects of negative life experiences on personality should be stronger than in younger participants with intellectual disability. However, it is important to note that the age of the participants studied by Zigler and his colleagues was diverse both within and across the studies, ranging even from 5.0 to 20 years of age in a single study (Zigler et al., 2002), and relations between age differences and specific personality traits were not analyzed by the authors. Based on descriptions available in the literature, we prepared tasks similar to those that were used to differentiate the performance of people with intellectual disability and controls in the original studies (Harter & Zigler, 1974; Yando & Zigler, 1971; Zigler & Balla, 1972). We aimed to create versions of these described tasks that would tap personality-motivational tendencies related to specific personality traits and at the same time would not be directly dependent on the level of the participants’ cognitive abilities. Also, we wanted to prepare tasks that would not be mundane and would not require failure feedback since experiences of failure may influence the performance of participants with intellectual disability (Gacek et al., 2017).
We performed a power analysis to ensure that the planned number of participants was sufficient for the expected effect sizes. This means that we estimated the expected power assuming a given number of participants and effect sizes. For most tasks, the effect sizes were estimated based on results of earlier studies that tested similar hypotheses with similar tools (Harter & Zigler, 1974; Yando & Zigler, 1971; Zigler & Balla, 1972) and they varied from f2 = .09 (for the Graduated Pegs task) to f2 = .58 (for the Marble in the Hole task). For the Probability Risk Task, we assumed the minimal effect size of interest (R2 = .10). Analysis was performed assuming N = 75 and α = .05. To assess the power, we used tools from the “WebPower” package for R (Zhang & Mai, 2022). The power for the tasks used in the study was satisfactory, ranging from .81 for the Probability Risk Task to over .99 for the Dice-Hole Task, and slightly lower only for the Pegs and Pucks Task (.75).
PARTICIPANTS AND PROCEDURE
ETHICAL CONSIDERATIONS
The study was approved by the ethical committee of the Pedagogical University of Krakow (approval number BN.0040-1/4/2020) and the relevant school boards. Written informed consent was obtained from all participants and from the parents of underaged participants.
PARTICIPANTS
We studied 75 students assigned to three groups. The participants’ level of general cognitive ability was assessed with Raven’s Standard Progressive Matrices (RSPM, Raven et al., 2000). The first group comprised 25 special vocational school (SVS) students with diagnoses of mild intellectual disability (56% boys, Mage = 17.16, SDage = 1.17, MRSPM = 28.64, SDRSPM = 8.07). The students’ diagnoses were based on ICD-10 (WHO, 1996) criteria and were provided by psychological-pedagogical counseling centers. We included neither students with secondary diagnoses, such as autism or hearing impairment, nor students with known organic etiology, such as Down syndrome. The second group comprised 25 mainstream vocational school (MVS) students without diagnoses of developmental disorders (56% boys, Mage = 17.4, SDage = 1.04, MRSPM = 42.56, SDRSPM = 6.77). The average RSPM score of this group was significantly higher than the mean of the SVS group (t[46.6]) = 6.61, p < .001). The third group comprised 25 primary school students (PSS, 52% boys, Mage = 8.16, SDage = 1.21, MRSPM = 30.28, SDRSPM = 9.39). The average RSPM score in this group did not differ significantly from the score of the students in the SVS group (t[46.93]) = 0.66, p = .511).
MEASURES
The Dice-Hole Task (DHT) is based on a description by Zigler and Balla (1972) of a task called “Marble in the Hole”, which was designed to measure responsiveness to social reinforcement. The task designed for our study involved a cardboard box with six holes marked with six different colors, and a set of 100 dice marked with colors which corresponded to the holes on the box. During the study, we asked participants to put six different dice as quickly as possible in the correct holes in two trials. As an indicator of negative-reaction tendency, we used the number of times the participant put six dice in the box during the first trial, when the experimenter did not give feedback that would reinforce the performance. As an indicator of positive-reaction tendency, we used the difference between the number of times the participant put six dice in the box in the second trial (in which the experimenter gave supportive feedback to the participant) and the first trial (ΔDHT).
The Sticker Task (ST) is a measure based on a description by Yando and Zigler (1971) of a task called “the Sticker Game”, which was designed to measure outerdirectedness. In our study, we prepared three pictures and sets of stickers that were suitable for each picture. The first picture presented a farm (see Appendix A in Supplementary materials); the second picture presented five black-and-white objects, such as a t-shirt or a baseball cap; the third picture presented five abstract paintings. Each picture had marked spots where the stickers could be placed. Each time a picture was presented to a participant, the experimenter presented her own picture and placed stickers in places of her own choosing, but these places had actually been assigned before the study. Then, the participant had to place stickers on an identical picture while the experimenter’s picture was still on the table. On the first picture, the experimenter placed farm animals; on the second picture, the experimenter placed colors that best suited the objects in her opinion; on the third picture, the experimenter marked from 1 to 5 paintings in terms of their attractiveness. The indicator of outerdirectedness in our study was the number of times the tested person placed stickers in the same way as the experimenter.
The Puzzle Difficulty Task (PDT) is a measure that assesses a preference for challenging tasks related to effectance motivation; it is based on a description by Harter and Zigler (1974) of a task called “Puzzle Preference”. In our task, we created four sets of puzzles. Three of them comprised 12 elements, and the last one comprised 16 elements. Each picture on the puzzles depicted a tree whose number of branches varied (see Appendix B in Supplementary materials). After finishing the first set of puzzles, the participant could choose to do the same set of puzzles again or try to finish an unknown and more difficult puzzle. The subjects were asked three times whether they wanted to do the same set of puzzles again or do a more difficult one. Effectance motivation was indicated by the number of times a participant decided to choose a more difficult set of puzzles.
The Maze Task (MT) is a measure that assesses variation seeking, which is indicative of effectance motivation; it is based on a description by Harter and Zigler (1974) of a task called “Box Maze”. Our task consisted of solving a maze presented on an A4 piece of paper. The maze had several correct paths and was designed such that each time it potentially required 23 different steps to reach the goal (see Appendix C in Supplementary materials). The score in our study was the number of segments in the second attempt that were different from the segments chosen in the first attempt.
The Choose-a-Door Task (CDT) is a measure that assesses curiosity, which is indicative of effectance motivation; it is based on a description by Harter and Zigler (1974) of a task called “Pictorial Curiosity”. In our task, we prepared 10 pictures of houses, each of which had two front doors (see Appendix A in Supplementary materials for an example). As in the original task, on one door there was a picture indicating what kind of object was behind the door, and on the other door was a blank spot. The score in this task was the number of times the participant chose to look at the novel picture.
The Pegs and Pucks Task (PPT) assesses mastery for the sake of competence, which is indicative of effectance motivation; it is based on a description by Harter and Zigler (1974) of a task called “Graduated Pegs”. Our task consisted of three trials. First, participants were presented with a wooden block and pegs designed in a similar way to those in the original study. The pegs could be placed randomly or systematically in the holes in the board such that their height matched the depth of the holes. Next, participants were presented with a wooden stick and a set of pucks of different widths which could be placed on the stick. Finally, participants were presented with two sticks and two sets of pucks. Effectance motivation in each trial was indicated by systematic arrangement of pegs and pucks without instruction from the experimenter on how to perform in this task.
The Probability Risk Task (PRT) is a task based on descriptions of a decision-making task that assesses expectancy of success (Bennett-Gates & Kreitler, 1999). In our study, we prepared a computer task in which participants were told that they needed to obtain a certain amount of virtual money by taking part in an internet auction and selling different items. Each time, participants could make a safe choice and obtain a fixed and average amount of virtual money, or they could make a risky choice which could lead to obtaining a smaller or bigger amount of virtual money than in the safe condition. The indicator of lowered expectancy of success in this task was the number of safe choices made by a participant.
PROCEDURE
The head researcher contacted school boards and obtained approval to conduct the study. The participants and their parents were given detailed instructions on the procedure. The participants were informed that they could withdraw from the study at any time without any consequences. Each participant was tested individually at school in a specially prepared room by a psychology student. The tasks were presented in the following order: Dice Hole Task (first trial), Sticker Task, Puzzle Difficulty Task, Maze Task, Choose-a-Door Task, Dice Hole Task (second trial), Pegs and Pucks Task, and Probability Risk Task. Detailed descriptions of the measures used in the study and the procedure are presented in Appendix D in Supplementary materials.
STATISTICAL ANALYSES
The data were analyzed with R (R Core Team, 2022). First, we calculated descriptive statistics: mean, median, and range for each group and in total, and correlations between all the measures, separately for each of the groups. Second, we used a linear model, a generalized linear model with binomial distribution, a generalized linear mixed-effects model, and ordered logistic regression (MASS package, Venables & Ripley, 2002) to estimate the difference between students of special vocational schools, students of mainstream vocational schools, and primary school students. All tests were one-tailed with α = .05. We applied Benjamini and Hochberg correction for multiple comparisons to all p-values.
RESULTS
Descriptive statistics for all the tasks are presented in Table 1. Mean scores in each of the tasks differ slightly between the groups. In each task, the direction of differences between the means in the tasks is in accordance with the assumptions of Zigler’s theory. The average number of times in the PDT task that people with intellectual disability chose a more difficult puzzle was the same as in the MVS group; however, this was still lower than in the PPS control group. Correlation analyses indicated that most correlations in each of the groups were not statistically significant and significant correlations were not consistent across the groups. Pearson correlation coefficients and respective p values for all the measures used in the study and for all the groups are presented in Appendix E in Supplementary materials.
Table 1
Descriptive statistics of all measured variables for each group and in total
[i] Note. SVS – special vocational school students, MVS – mainstream vocational school students, PSS – primary school students, Med – median, DHT – Dice-Hole Task, ΔDHT – difference between trials in Dice-Hole Task, ST – Sticker Task, PDT – Puzzle Difficulty Task, MT – Maze Task, CDT – Choose-a-Door Task, PPT – Pegs and Pucks Task, PRT – Probability Risk Task.
To assess the differences between the studied groups, we employed several statistical tests that considered the distribution of the dependent variable, the distribution of residuals, and the type of aggregation of the results. In the first step of the analyses, we used a general linear model for variables for which the dependent variable could be treated as continuous (at least 9 levels and normal-like distribution). In the Sticker Task, the sum of imitated original designs in the SVS group did not differ from the sum in the MVS group (p = .087, adjusted p = .339) or in the PSS group (p = .067, adjusted p = .339, R2 = .01, F(2, 72) = 1.40). The residuals were normally distributed (W = .97, p = .108). Similarly, in the Choose-a-Door Task we did not observe any difference between the SVS group and either the MVS group (p = .440, adjusted p = .492) or the PPS group (p = .147, adjusted p = .339, R2 = 0, F(2, 72) = 0.65). In the Probability Risk Task, there was also no difference between the SVS group and either the MVS group (p = .148, adjusted p = .339) or the PPS group (p = .390, adjusted p = .492, R2 = 0, F(2, 72) = 0.59). In the Choose-a-Door Task and the Probability Risk Task, the Shapiro-Wilk test indicated that the residuals were not normally distributed (respectively W = .92, p < .001 and W = .96, p = .016), but visual examination of the residuals did not reveal any major departures from normality.
In the next step of the analysis, we assumed that in the Puzzle Difficulty Task the sum of decisions to choose a more difficult puzzle should be treated as the sum of independent decisions in the three decision situations. Thus, we expected that this variable would have a binomial distribution, and this is what we observed; therefore, we fitted a generalized linear model to these data. There was no significant difference between the SVS group and the two other groups (MVS, p = .500, adjusted p = .500; PPS, p = .070, adjusted p = .339; AIC = 172.73; null deviance [74] = 130.72; residual deviance [72] = 127.81).
In the third step, we noted that the number of sets of dice put in the box in the Dice Hole Task also had a Poisson distribution. To include both the value observed in the first trial and the difference between the second and first trial, we fitted a generalized linear mixed-effects model to the data. There was no effect of group, either on the value observed in the first trial or on the difference between the trials. Table 2 presents all the coefficients estimated in this analysis.
Table 2
Coefficients of generalized linear mixed-effects model for the Dice-Hole Task. The point estimation for trial shows the difference between the second and the first trial. The interaction between group and trial shows the effect of group on this difference
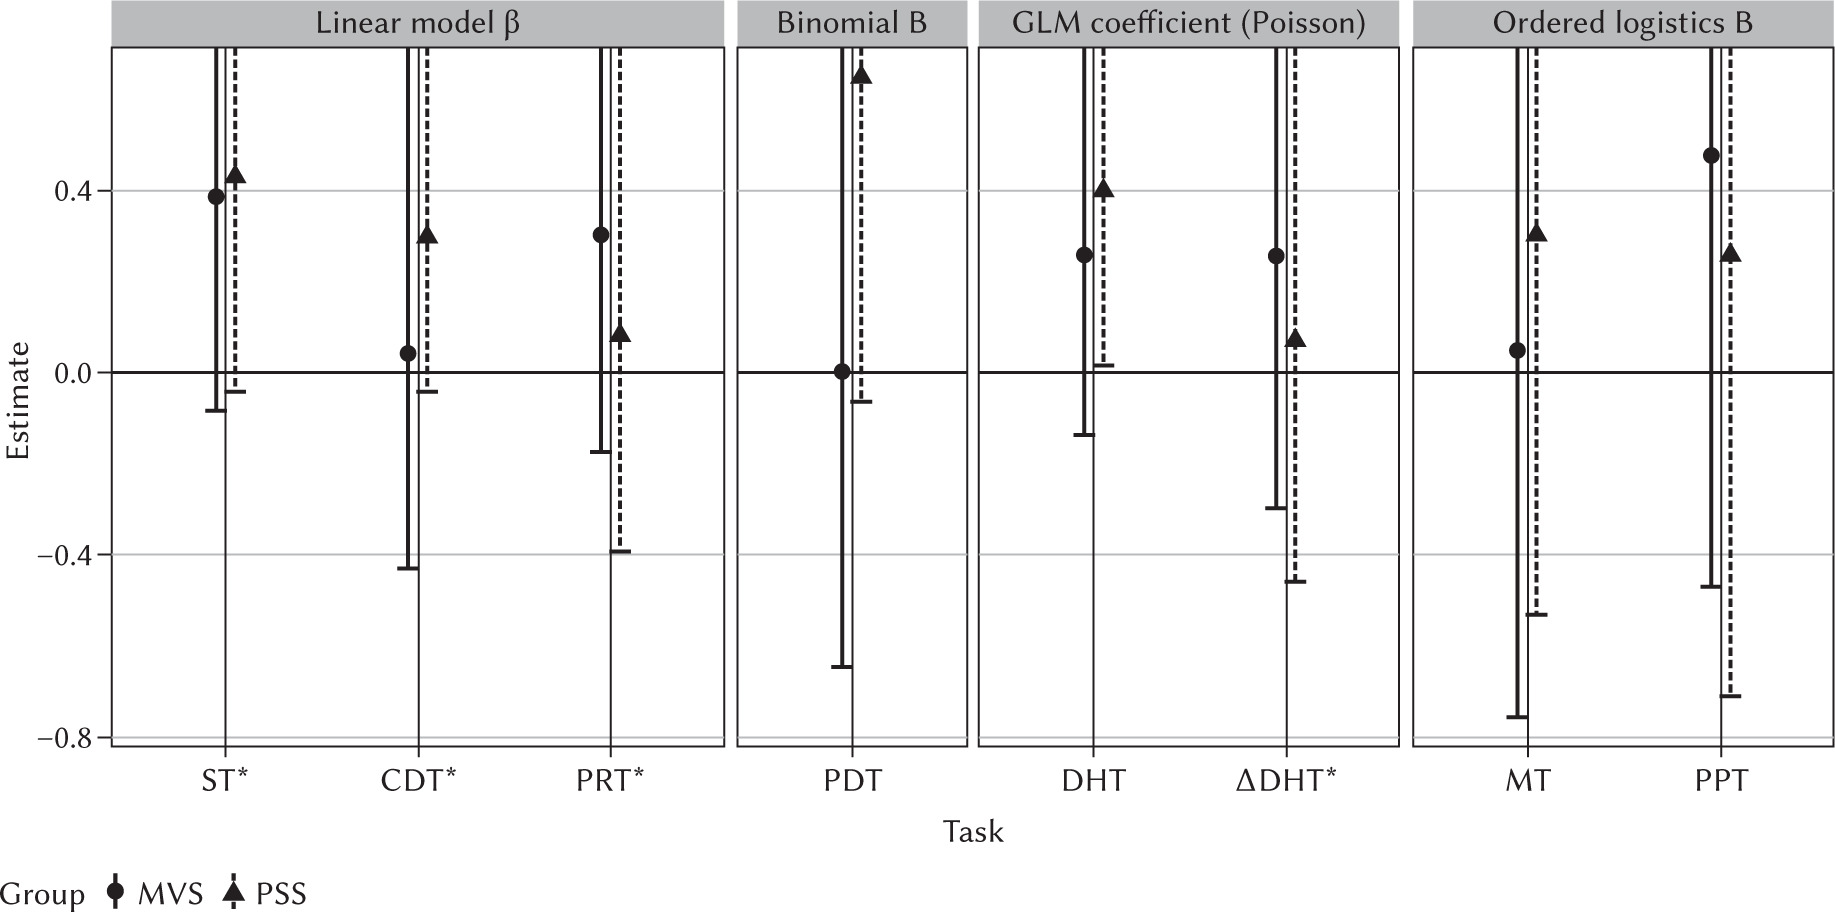
In the final step of the analysis, we applied an ordered logistic regression for the variables with a low number of possible values. We did not find any differences in the Maze Task between the SVS group and the MVS group (p = .461, adjusted p = .492) or the PPS group (p = .277, adjusted p = .444, AIC = 350.90, residual deviance = 326.90). Also, in the Pegs and Pucks Task there was no difference between groups (p = .206, adjusted p = .398 and p = .334, adjusted p = .486, for MVS and PPS respectively, AIC = 145.97, residual deviance = 135.97). Figure 1 presents differences between groups for all the tasks relative to their expected direction in regard to Zigler’s theory (i.e., positive values are expected on the basis of the hypothesis), with one-sided unadjusted 95% confidence intervals for effects.
Figure 1
Estimates and 95% one-tailed confidence intervals of the effects
Note. The effects relate to differences between the students of a special vocational school and two reference groups: students of mainstream vocational schools (MVS, circles), and primary school students (PSS, triangles). The effects are grouped according to the type of test (respective panels). All effects are plotted in the direction of the expected difference, which means that some of them are reversed. The tasks with reversed effects are indicated with an asterisk. β – standardized regression coefficient, B – regression coefficient, GLM – generalized linear model. ST – Sticker Task, CDT – Choose-a-Door Task, PRT – Probability Risk Task, PDT – Puzzle Difficulty Task, DHT – Dice-Hole Task, ΔDHT – difference between trials in Dice-Hole Task, MT – Maze Task, PPT – Pegs and Pucks Task.
DISCUSSION
In our study we aimed to conceptually replicate studies on specific personality traits attributed to people with intellectual disability (Zigler, 1999; 2001). We used seven tasks that we prepared based on descriptions in the literature to compare the performance of special vocational school students with mild intellectual disability against students of mainstream vocational schools and students of primary schools that were matched at the level of general cognitive functioning. We treated the scores obtained in the tasks as indicators of positive- and negative-reaction tendencies (Zigler & Balla, 1972), expectancy of success (Bennett-Gates & Kreitler, 1999), outerdirectedness (Yando & Zigler, 1971), and four different aspects of effectance motivation (Harter & Zigler, 1974). Most correlations between the measures for each of the groups were not statistically significant, which is in accordance with the assumption that the measures tapped different aspects of personality functioning. Lack of significant correlations consistent across groups may be a result of the small number of participants in each of the groups. The results of our study do not support the hypothesis regarding differences between people with intellectual disability and people from the general population; as such, they are not in accordance with the results of previous studies conducted by Zigler and colleagues. We propose several possible explanations for these results.
First, to the best of our knowledge, our study is the first attempt in over twenty years to assess specific personality traits using experimental tasks. Considering the fact that, according to Zigler’s theory, specific traits develop in interaction with the environment, it seems possible that the lack of significant differences between the groups in our study is related to contextual factors. Since most of the studies regarding specific personality traits were conducted in the 1970s, we may suppose that nowadays, due to improvements in social policies and support systems, people with mild intellectual disability experience failures and situations of social rejection less often than half a century ago; therefore the specific traits do not manifest in this group as strongly as in previous studies. Although this explanation seems reasonable considering changes in attitudes towards people with intellectual disability in Western societies throughout the years, it is also a speculation, and in this article we are not able to present empirical evidence to support this claim.
Second, the lack of difference between the groups in our study may also stem from differences in diagnostic practices. In most of their studies, Zigler and colleagues attempted to include people with mild intellectual disability of unspecified etiology related to low socio-economic status (Zigler & Balla, 1972; Harter & Zigler, 1974; Zigler et al., 2002). However, we assume that different genetic conditions which would result in exclusion from the study are nowadays diagnosed more often than they were in the 1970s. Such conditions may be related to specific behavioral phenotypes (Dykens, 2021). In our study we did not include participants with diagnoses of genetic syndromes often related to intellectual disability. However, in this context, it is important to note that we also cannot exclude with complete certainty the possibility that some participants had genetic conditions which had not been clinically recognized. Furthermore, the diagnosis of intellectual disability in our study was based on ICD-10 criteria. In previous studies of specific personality traits, exact information about the criteria on which the participants’ diagnoses were based was not provided. It is possible that diagnostic criteria differences between studies may have led to differences in group structure. Finally, it also seems possible that, in previous research, groups of people with intellectual disability comprised people that currently would be diagnosed with different conditions. Certain behavioral tendencies, such as avoidance of contact with strangers or repeating the same answer in successive trials, may currently be considered more characteristic of people diagnosed with autism. The presence of such participants in studied groups could potentially influence the results.
As for the limitations of our study, it is important to note that we performed a conceptual replication using measures that differed from the measures in the original studies. When analyzing the descriptive statistics, we noted that the average mean scores of people with intellectual disability were always in the direction predicted by Zigler’s theory. However, none of the mentioned differences were statistically significant. It is possible that some differences between groups would be statistically significant in a study that used a larger sample. However, based on our results, the expected effect sizes would be rather small, and the predictive value of such traits would be rather dubious. As for the measures used, we aimed to create measures which would not be mundane and directly dependent on the level of cognitive abilities. However, the original version of the task on which our Dice-Hole Task was based was mundane (Zigler & Balla, 1972). It is possible that social reinforcement has a different impact on participants in a mundane situation, which may lead to differences in performance. Also, in our study we did not obtain information regarding the participants’ socio-economic status. As Zigler’s theory underlines the role of the environment in the development of specific personality traits, it is possible that the participants’ socio-economic background might be important in relation to their performance in given tasks. Finally, we did not include other measures of functioning, except Raven’s Matrices, which could provide information regarding the validity of the tasks we used.
As for future studies, it seems important to involve other groups which may differ as regards specific personality functioning, such as students with diagnoses of genetic conditions or a moderate level of intellectual disability. It would also be valuable to consider the contextual factors which may be related to development of certain personality-motivational tendencies, such as the types of school that participants with intellectual disability attend and their socio-economic background. Also, it would be beneficial to confirm the validity of proposed experimental tasks using other measures, such as questionnaires which allow caregivers to assess the functioning of a person with disability (Gacek et al., 2022). Future research should focus not only on determining whether specific personality traits are actually more specific to people with intellectual disability than to people in the general population, but also on the predictive value of the constructs under study.