BACKGROUND
The Basic Psychological Needs Theory (BPNT) – one of the mini-theories of Deci and Ryan’s Self-Determination Theory (SDT; Deci & Ryan, 2000; Ryan & Deci, 2000a, b) – assumes that there are three basic and universal psychological needs: autonomy, competence and relatedness. The need for autonomy relates to the experience of will and self-acceptance of the actions taken. The need for competence determines the sense of efficiency and agency, which consequently leads an individual to take on actions that are challenging and that may contribute to its development. The need for relatedness refers to the formation of relationships with other people as well as experiencing warmth and care from significant others (Chen et al., 2015; Deci & Ryan, 2000; Ryan & Deci, 2000a, b; Vansteenkiste & Ryan, 2013). Ryan and Deci (2000b) define a need as an innate psychological stimulant necessary for self-determination, continuous development, integration, and well-being throughout the individual’s entire life. Needs satisfaction is associated with individuals’ sense of well-being, good functioning, pursuit of development and higher self-esteem. On the other hand, if needs are not satisfied, especially when frustrated, it can lead to deterioration of mental well-being, worse implementation of life’s tasks or even worse mental and social functioning. Chronic frustration of needs along with poor coping resources contributes to the development of compensatory coping strategies. Consequently, it might lead to the development of functioning disorders (Vansteenkiste & Ryan, 2013).
Self-Determination Theory initially focused mainly on the importance of needs satisfaction for the general prosperity of an individual (Deci & Ryan, 2002; Ryan & Deci, 2000a). However, as research progressed, it was noted that low satisfaction of needs does not necessarily lead to frustration. To fully explain what determines the well-being and prosperity of an individual, as well as the malfunctioning, maladjustment, and psychopathology, it is necessary to take into account the frustration of needs. Measuring the frustration of basic psychological needs makes it possible to fully and empirically discover their importance, not only for psychological well-being but especially for malfunctioning and disorders (Bartholomew et al., 2011; Kuźma et al., 2020; Vansteenkiste & Ryan, 2013).
The Basic Psychological Need Satisfaction and Frustration Scale (BPNS&FS) was developed to empirically investigate both the satisfaction and frustration of basic needs (Chen et al., 2015). It consists of six subscales corresponding to three independently measured needs in two aspects, i.e. their satisfaction and frustration (for a detailed description of the tool see below).
So far, the scale has been adapted and translated into several languages, including Japanese (Nishimura & Suzuki, 2016), Italian (Costa et al., 2017), German (Heissel et al., 2018) and recently Polish (Kuźma et al., 2020). In each of these adaptations, it was finally assumed that the model that best reflects the theoretical structure of the BPNS&FS is the six-factor model, independently taking into account satisfaction and frustration regarding each of the three needs.
Our study aimed to prepare and validate the Polish language version of the BPNS&FS. Another Polish adaptation of the tool by Kuźma et al. (2020) was released during the research. Nevertheless, we found it necessary to publish the results1. Our study was carried out with a different program, on a larger and clearly described sample, and using a traditional paper and pencil method. Additionally, other validation variables were used, and three potential models referring to theory were tested to assess the theoretical validity. Kuźma et al. (2020) conducted their research mainly via an online research portal in four samples ranging from 158 to 272 people, with a majority of women and an age range from 18 to 90 years. The presentation of our results will broaden the range of information about the properties and values of this tool by verifying the results of Kuźma et al. (2020). In our research, we focused on the importance of satisfying and frustrating basic psychological needs for clarifying conditionalities, both psychological well-being and, above all, poor functioning and risk of mental disorders – mainly concerning alcohol use.
Self-Determination Theory assumes that there are two independent dimensions of experiencing each of the three needs, i.e. satisfaction and frustration (Chen et al., 2015; Kuźma et al., 2020; Vansteenkiste & Ryan, 2013). Therefore, to confirm the validity of the BPNS&FS in the Polish version we expected that (H1) the items of the questionnaire, appropriately to their content, would indicate satisfaction or frustration in terms of each of the three needs (Chen et al., 2015). According to the theory (Chen et al., 2015; Vansteenkiste & Ryan, 2013) and the results of other linguistic adaptations of the BPNS&FS (Costa et al., 2017; Heissel et al., 2018; Kuźma et al., 2020), three probable models that reflect the structure of the measure were tested: 1) a three-factor model, including eight observed variables indicating both satisfaction and frustration of each of the three correlated needs – making up the latent variables; 2) a six-factor model, taking into account the satisfaction and frustration of each of the three correlated needs independently – as latent variables – each of which is determined by four observed variables; 3) and a higher-order model, in which latent variables of the second order are independently satisfaction and frustration determined by first-order hidden variables, which are the three basic needs, and each of them is respectively determined by four explicit variables. It was predicted that the theoretical validity of the Polish version of BPNS&FS would be best confirmed – as in other adaptations – in a six-factor model (e.g. Costa et al., 2017; Heissel et al., 2018; Kuźma et al., 2020).
To verify the convergent and discriminant validity the following hypotheses were tested. Firstly, we hypothesized that psychological well-being and its resources significantly positively correlate with the satisfaction of basic psychological needs and negatively with their frustration (H2). Secondly, we hypothesized that a positive correlation exists between the frustration of needs and the perception of psychological pain, and a negative correlation between psychological pain and the satisfaction of needs (H3). Thirdly, we hypothesized a positive relationship between need frustration and symptoms of mental health disorders as well as negative relations between need satisfaction and these symptoms (H4). Fourthly, we hypothesized a positive relationship between need frustration and the increased risk of addictive alcohol use as well as a negative association between need satisfaction and that risk (H5). Finally, it was expected that alcohol-addicted individuals participating in therapy would achieve higher results in terms of the frustration of needs than those from a normative sample (H6). We decided to include patients addicted to alcohol because alcohol is a well-known substitute for frustrated needs (Marlatt, 1999; Vansteenkiste & Ryan, 2013). If frustration does really affect the risk of mental health disorders more than just failure to meet these needs, this relationship should be reflected in the differences between the normative sample and alcoholics.
Another Polish adaptation of the BPNS&FS (Kuźma et al., 2020) appeared during our research, so we decided to investigate whether the results obtained using our version of the tool would be equivalent to the results obtained using the tool in the above-mentioned adaptation (H7).
PARTICIPANTS AND PROCEDURE
PROCEDURE AND PARTICIPANTS
The first step of the Polish adaptation of the BPNS&FS was the establishment of a Polish translation. First, all the items of the scale were translated into the Polish language independently by six translators familiar with the assumptions of the theory (Chen et al., 2015). Next, as the result of the discussion, one coherent version of the scale was established by the same group of translators. Then a translation equivalence study of Polish and English versions was carried out using a bilingual response method (Hornowska & Paluchowski, 2004). It was conducted involving final-year students fluent in both English and Polish languages from the Institute of English Studies. The research was carried out in two groups where participants were given different language versions of the tool with a two-week interval between the test and retest. Ultimately, analyses were performed on data obtained from 24 participants who completely filled out both the Polish and English versions of the questionnaire.
After the equivalence of the Polish and the original version of the scale was confirmed, the validity and reliability were examined. The research was carried out with traditional methods, paper and pencil testing, voluntarily and anonymously. Firstly, the BPNS&FS reliability was tested using a test-retest procedure among 56 students with an interval of three weeks between studies. Further research on the reliability and validity was conducted in a large normative sample (N = 736) of participants recruited by trained psychology students cooperating with us (see Table 1).
Table 1
Characteristics of samples
To confirm the validity of the tool, a study of differences in satisfaction and frustration of basic psychological needs, between a normative sample and people undergoing treatment for alcohol addiction (clinical sample), was carried out (see H6). For this purpose, a group of 303 people with sociodemographic characteristics similar to the clinical sample was selected from the normative sample. Table 1 contains the characteristics of all tested trials with detailed steps and procedures.
Finally, the equivalence of the results measured by our and the Kuźma et al. (2020) versions of the BPNS&FS was tested. Due to the SARS-CoV-2 pandemic, the study was conducted online using Google Forms, on a sample of 38 students. It was voluntary and anonymous, with coded responses so that they could be repeated. Half of the participants first completed our version of the questionnaire, while the other half filled out the Kuźma et al. (2020) version. After two weeks, 23 people (age M = 22.40, Me = 22.00, 74% of women, 26% of men) who wanted to re-participate in the study completed an alternative version of the questionnaire.
MEASURES
The Basic Psychological Need Satisfaction and Frustration Scale (BPNS&FS) by Chen et al. (2015) consists of 24 statements, with answers ranging on a scale from 1 (definitely no) to 5 (definitely yes). It measures the satisfaction and frustration of three basic psychological needs: autonomy, competence, and relatedness. Scores are calculated for each of the six subscales and they range from 4 to 20. The higher the score, the greater is the satisfaction or frustration of a given need. The internal consistency of the subscales in the authors’ research ranged from .64 to .89, factor loadings for individual items ranged from .62 to .80, and coefficients of determination (R2) ranged from .38 to .64 (Chen et al., 2015). In the Polish adaptation of Kuźma et al. (2020), Cronbach’s α ranged from .62 to .82.
The Oxford Happiness Questionnaire (OHQ; Hills & Argyle, 2002) in the Polish adaptation of Poprawa (2012) measures subjective psychological well-being and the subjective properties that determine it, known as the resources of happiness. It consists of 29 items, which are rated on a scale from 1 (strongly disagree) to 6 (strongly agree). The higher the total score, the greater are the sense of happiness and the subjective potentials that determine it. In adaptive studies, high-reliability rates and satisfactory results of validity analyses were achieved (Poprawa, 2012). In the currently tested sample, Cronbach’s α was .92.
The General Health Questionnaire (GHQ-28; Goldberg, 1978) in the Polish adaptation by Makowska and Merecz (2001) consists of 28 items and is used to assess mental health. Depending on the question, participants have a choice of four answers. This differentiates the severity of symptoms. The study adopted the form of scoring responses from 0 to 3 (Frydecka et al., 2010). The questions relate to four symptom areas: A – somatic disorders, B – anxiety, C – functioning disorders, and D – depression. In each subscale, it is possible to obtain a total of 0 to 21 points. The higher the score, the more severe are the symptoms. In the currently tested sample, Cronbach’s α ranged from .76 to .90 for individual symptoms.
The Psychache Scale (PS; Holden et al., 2001) in the Polish adaptation of Chodkiewicz et al. (2017) consists of 13 items and is used to test adults. It measures the current intensity of perceived psychological pain. Answers are rated on a 5-point Likert scale ranging from 1 (I strongly disagree) to 5 (I strongly agree). The higher the score (in a range of 13-65 points), the stronger is the feeling of psychological pain. In the Polish adaptation, Cronbach’s α ranged from .90 to .96. In the currently tested sample, Cronbach’s α was .95.
The Alcohol Use Scale (AUS; Poprawa, 2013) estimates the level of involvement in alcohol use, from abstinence to harmful drinking and probable addiction based on the average sum of 11 weighted indicators of diagnostic criteria. The overall AUS score ranges from 0 to 3.68 points, and the higher it is, the greater the commitment to alcohol use and the risk of addiction. The empirical research conducted so far indicates very good psychometric properties of this tool, both its reliability and validity (Poprawa, 2013, 2015). In the currently tested sample, Cronbach’s α for the overall result was .89.
DATA ANALYSIS
The analysis was performed using TIBCO Software Statistica v.13.3 and IBM SPSS AMOS v.25.
The equivalence of the original and the Polish translation was tested using Pearson’s correlation analysis and the sign test (Z). Then, the assessment of theoretical validity was carried out with confirmatory factor analysis (CFA) using the generalized least squares method. Several goodness-of-fit indexes were used. The corrected χ2 by degrees of freedom (χ2/df) should be less than 3.0 (Carmines & McIver, 1983). RMSEA (root mean square error of approximation) should be less than .05, however, results less than .08 are also acceptable if they fall between the lowest and highest values observable in the population with 90% certainty (Browne & Cudeck, 1993). The GFI (goodness-of-fit index) and AGFI (adjusted goodness-of-fit index) indicators should take on a value greater than .90. RMR (root mean squared residual) does not have an acceptability criterion, so its values can only be compared between the analyzed models, knowing that in the ideal model it takes on the value of 0. The Akaike information criterion (AIC) does not have an acceptability criterion either, so it estimated the quality of the model, relative to each other tested model. The lower the value it takes, the better the model is (Bedyńska & Książek, 2012).
Reliability was assessed based on the test-retest coefficient (rtr), internal consistency of the subscales measured with Cronbach’s α, and the item-total correlation (rit) (Hornowska, 2009).
Criterion, convergent, and differential validity were assessed using Pearson’s correlation analysis of the BPNS&FS subscale with the results of OHQ, PS, GHQ, and AUS. The equivalence of results of both Polish versions of the tool was also assessed using Pearson’s correlation coefficient (r) and by analyzing the significance of differences with the sign test (Z). Also, an analysis of differences between the normative group and the clinical group was performed using the Mann-Whitney U test. The same test was used to examine gender differences. Non-parametric tests were performed because the normality assumption was not met for any tested group. Descriptive statistics of BPNS&FS results were also performed.
RESULTS
TRANSLATION EQUIVALENCE
Correlations of results for Polish and English language versions in the study on bilingual subjects were very high and ranged for individual subscales from rtr = .62 to rtr = .90, p < .001. The results of Z test analysis showed no statistically significant (p > .05) differences between answers in the Polish and English versions of the scale.
CONFIRMATORY FACTOR ANALYSIS
Then, CFA was performed for the following three models: three-factor, six-factor, and higher-order. The goodness of fit indexes for each of them are presented in Table 2.
Table 2
The goodness-of-fit indexes in three CFA models
| Model | Figure | χ2/df | RMSEA | 90% CI for RMSEA | RMR | GFI | AGFI | AIC |
|---|---|---|---|---|---|---|---|---|
| Three-factor | 1 | 3.25 | .055 | .051-.060 | .079 | .908 | .889 | 911.68 |
| Higher order | 2 | 2.86 | .050 | .046-.055 | .060 | .920 | .903 | 811.53 |
| Six-factor | 3 | 2.45 | .044 | .040-.049 | .045 | .934 | .917 | 705.66 |
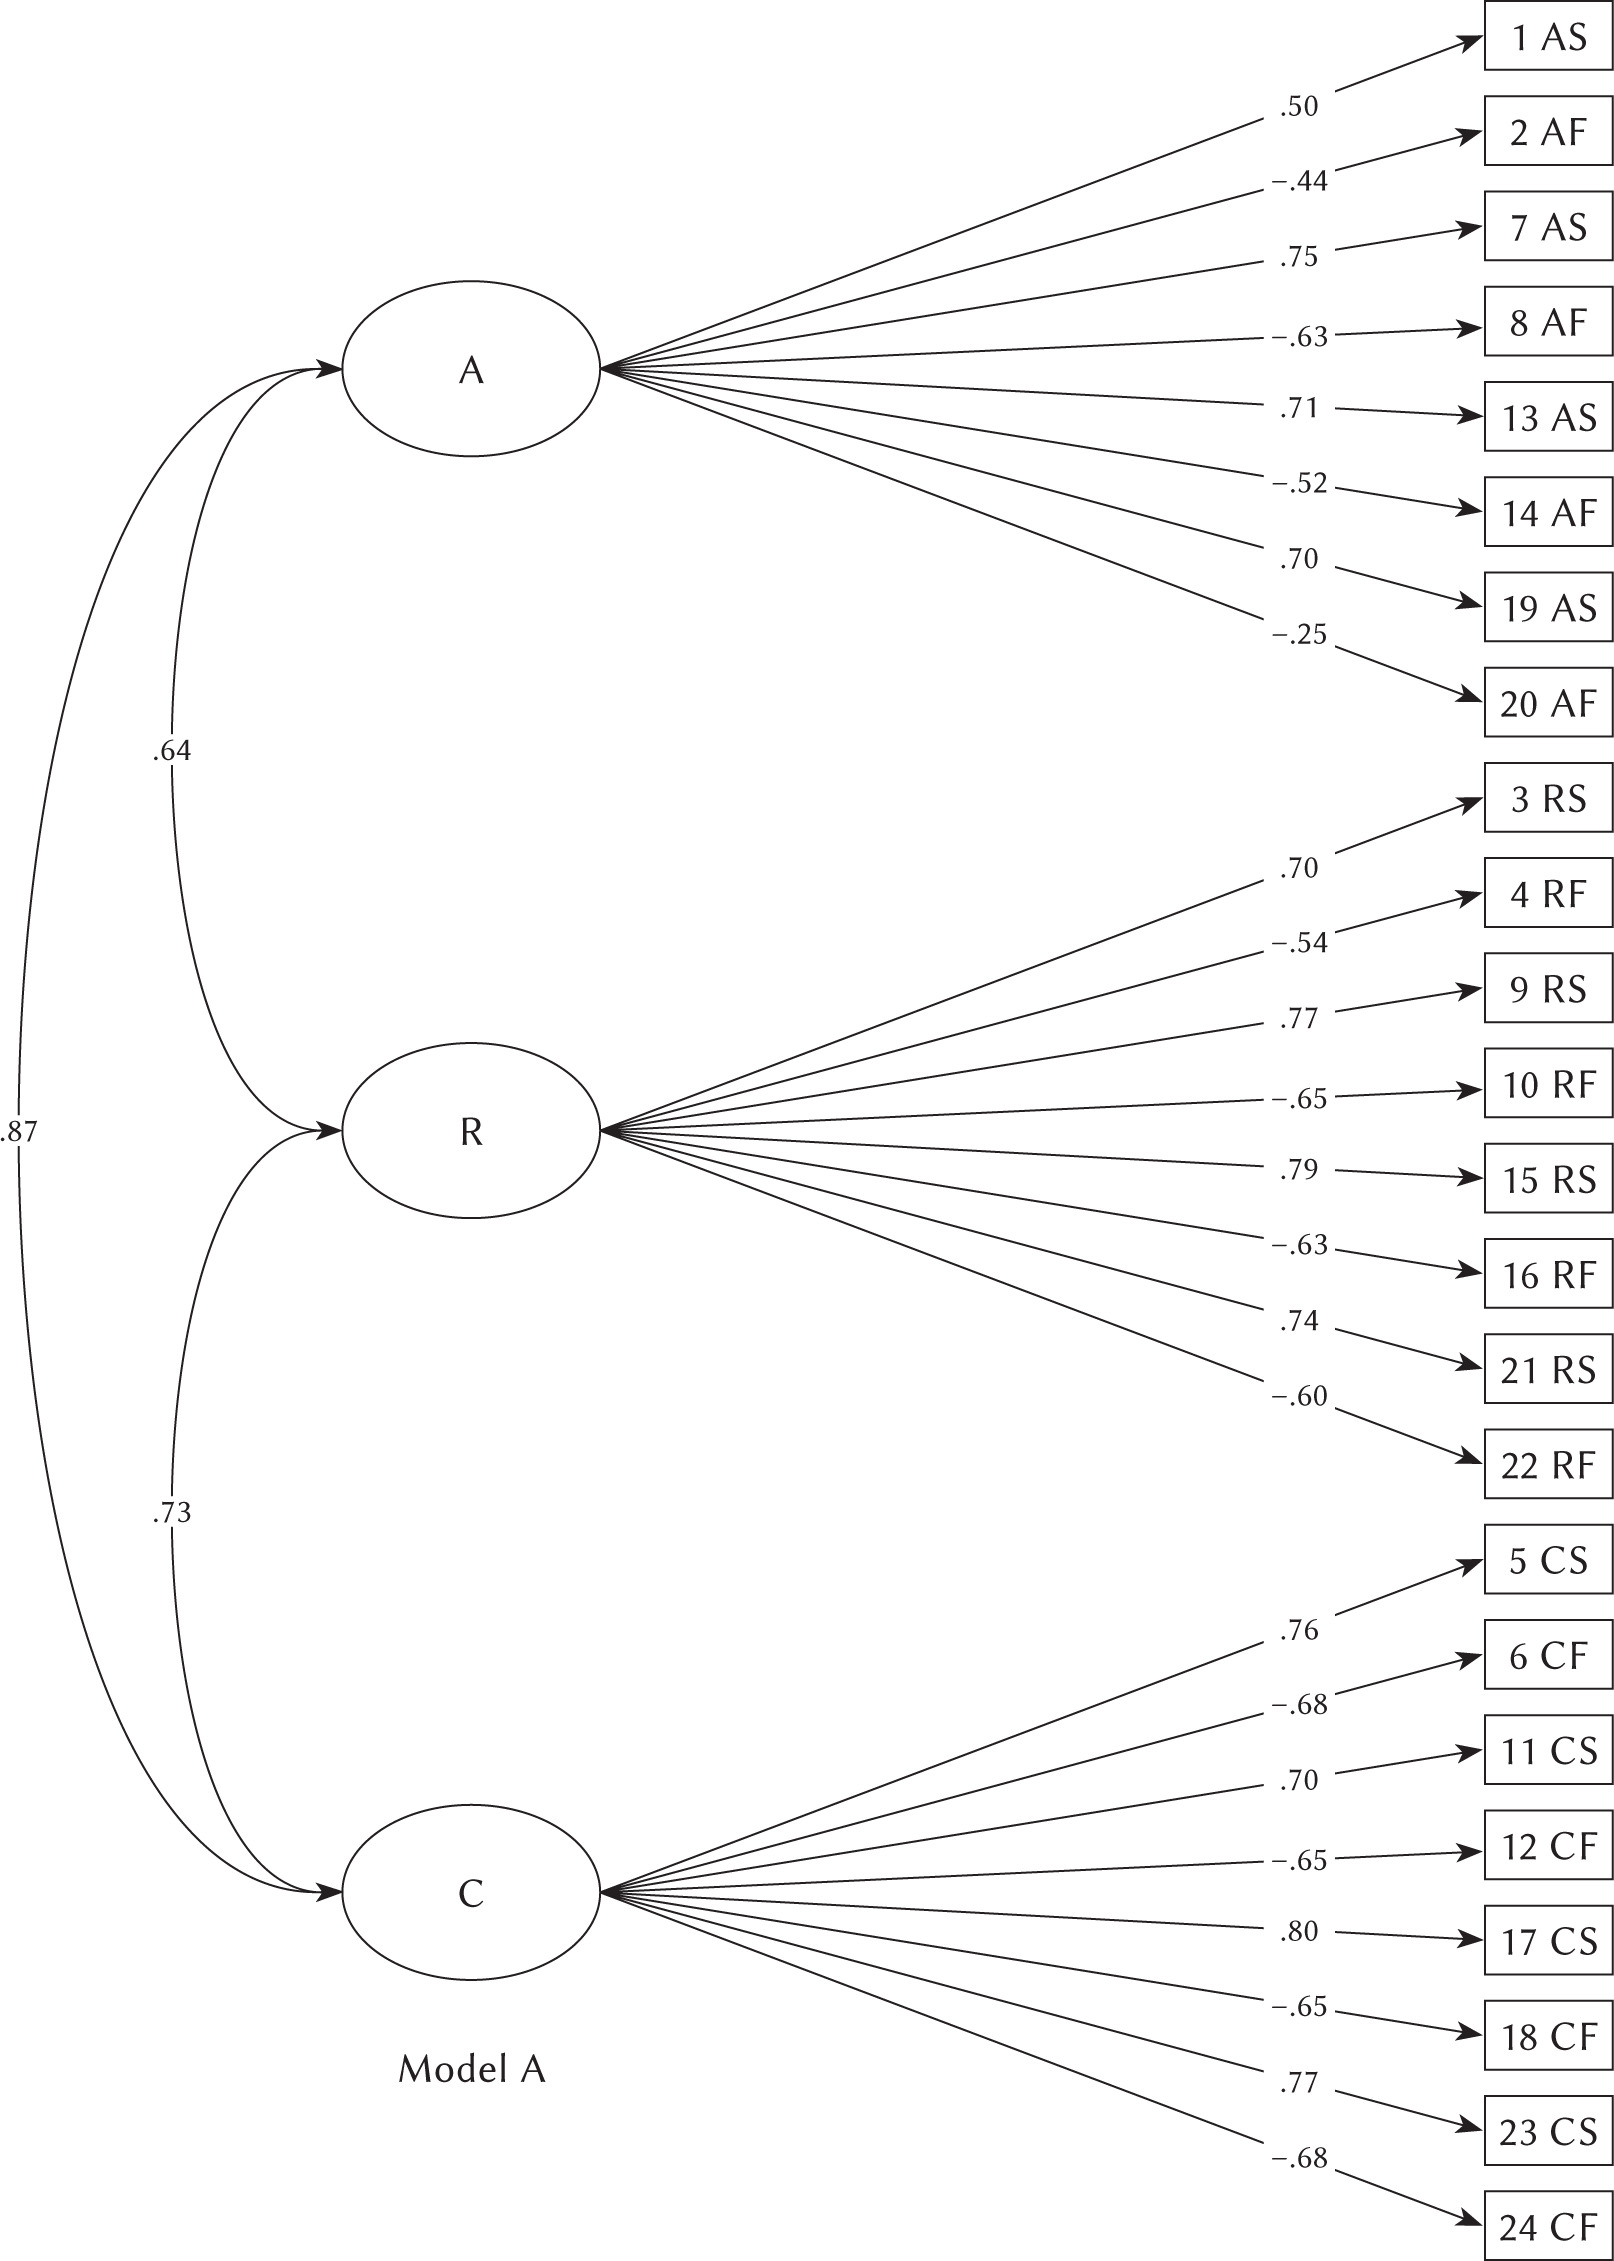
The 3-factor model (see Figure 1) assumed three hidden variables: the need for autonomy, relatedness, and competence. Each of them was represented by 8 items in terms of both satisfaction and frustration. BPNS&FS items significantly loaded hidden factors positively in terms of satisfaction and negatively in terms of frustration, from low β = –.25 (for 20AF) to high .80 (for 17CS); most β > .60. The weakest was the two factor loadings (β < .50) of the autonomy items (2AF, and 20AF). The needs were highly positively correlated with each other.
Figure 1
Three-factor BPNS&FS model
Note. A – autonomy; AS – autonomy satisfaction; AF – autonomy frustration; R – relatedness; RS – relatedness satisfaction; RF – relatedness frustration; C – competence; CS – competence satisfaction; CF – competence frustration.
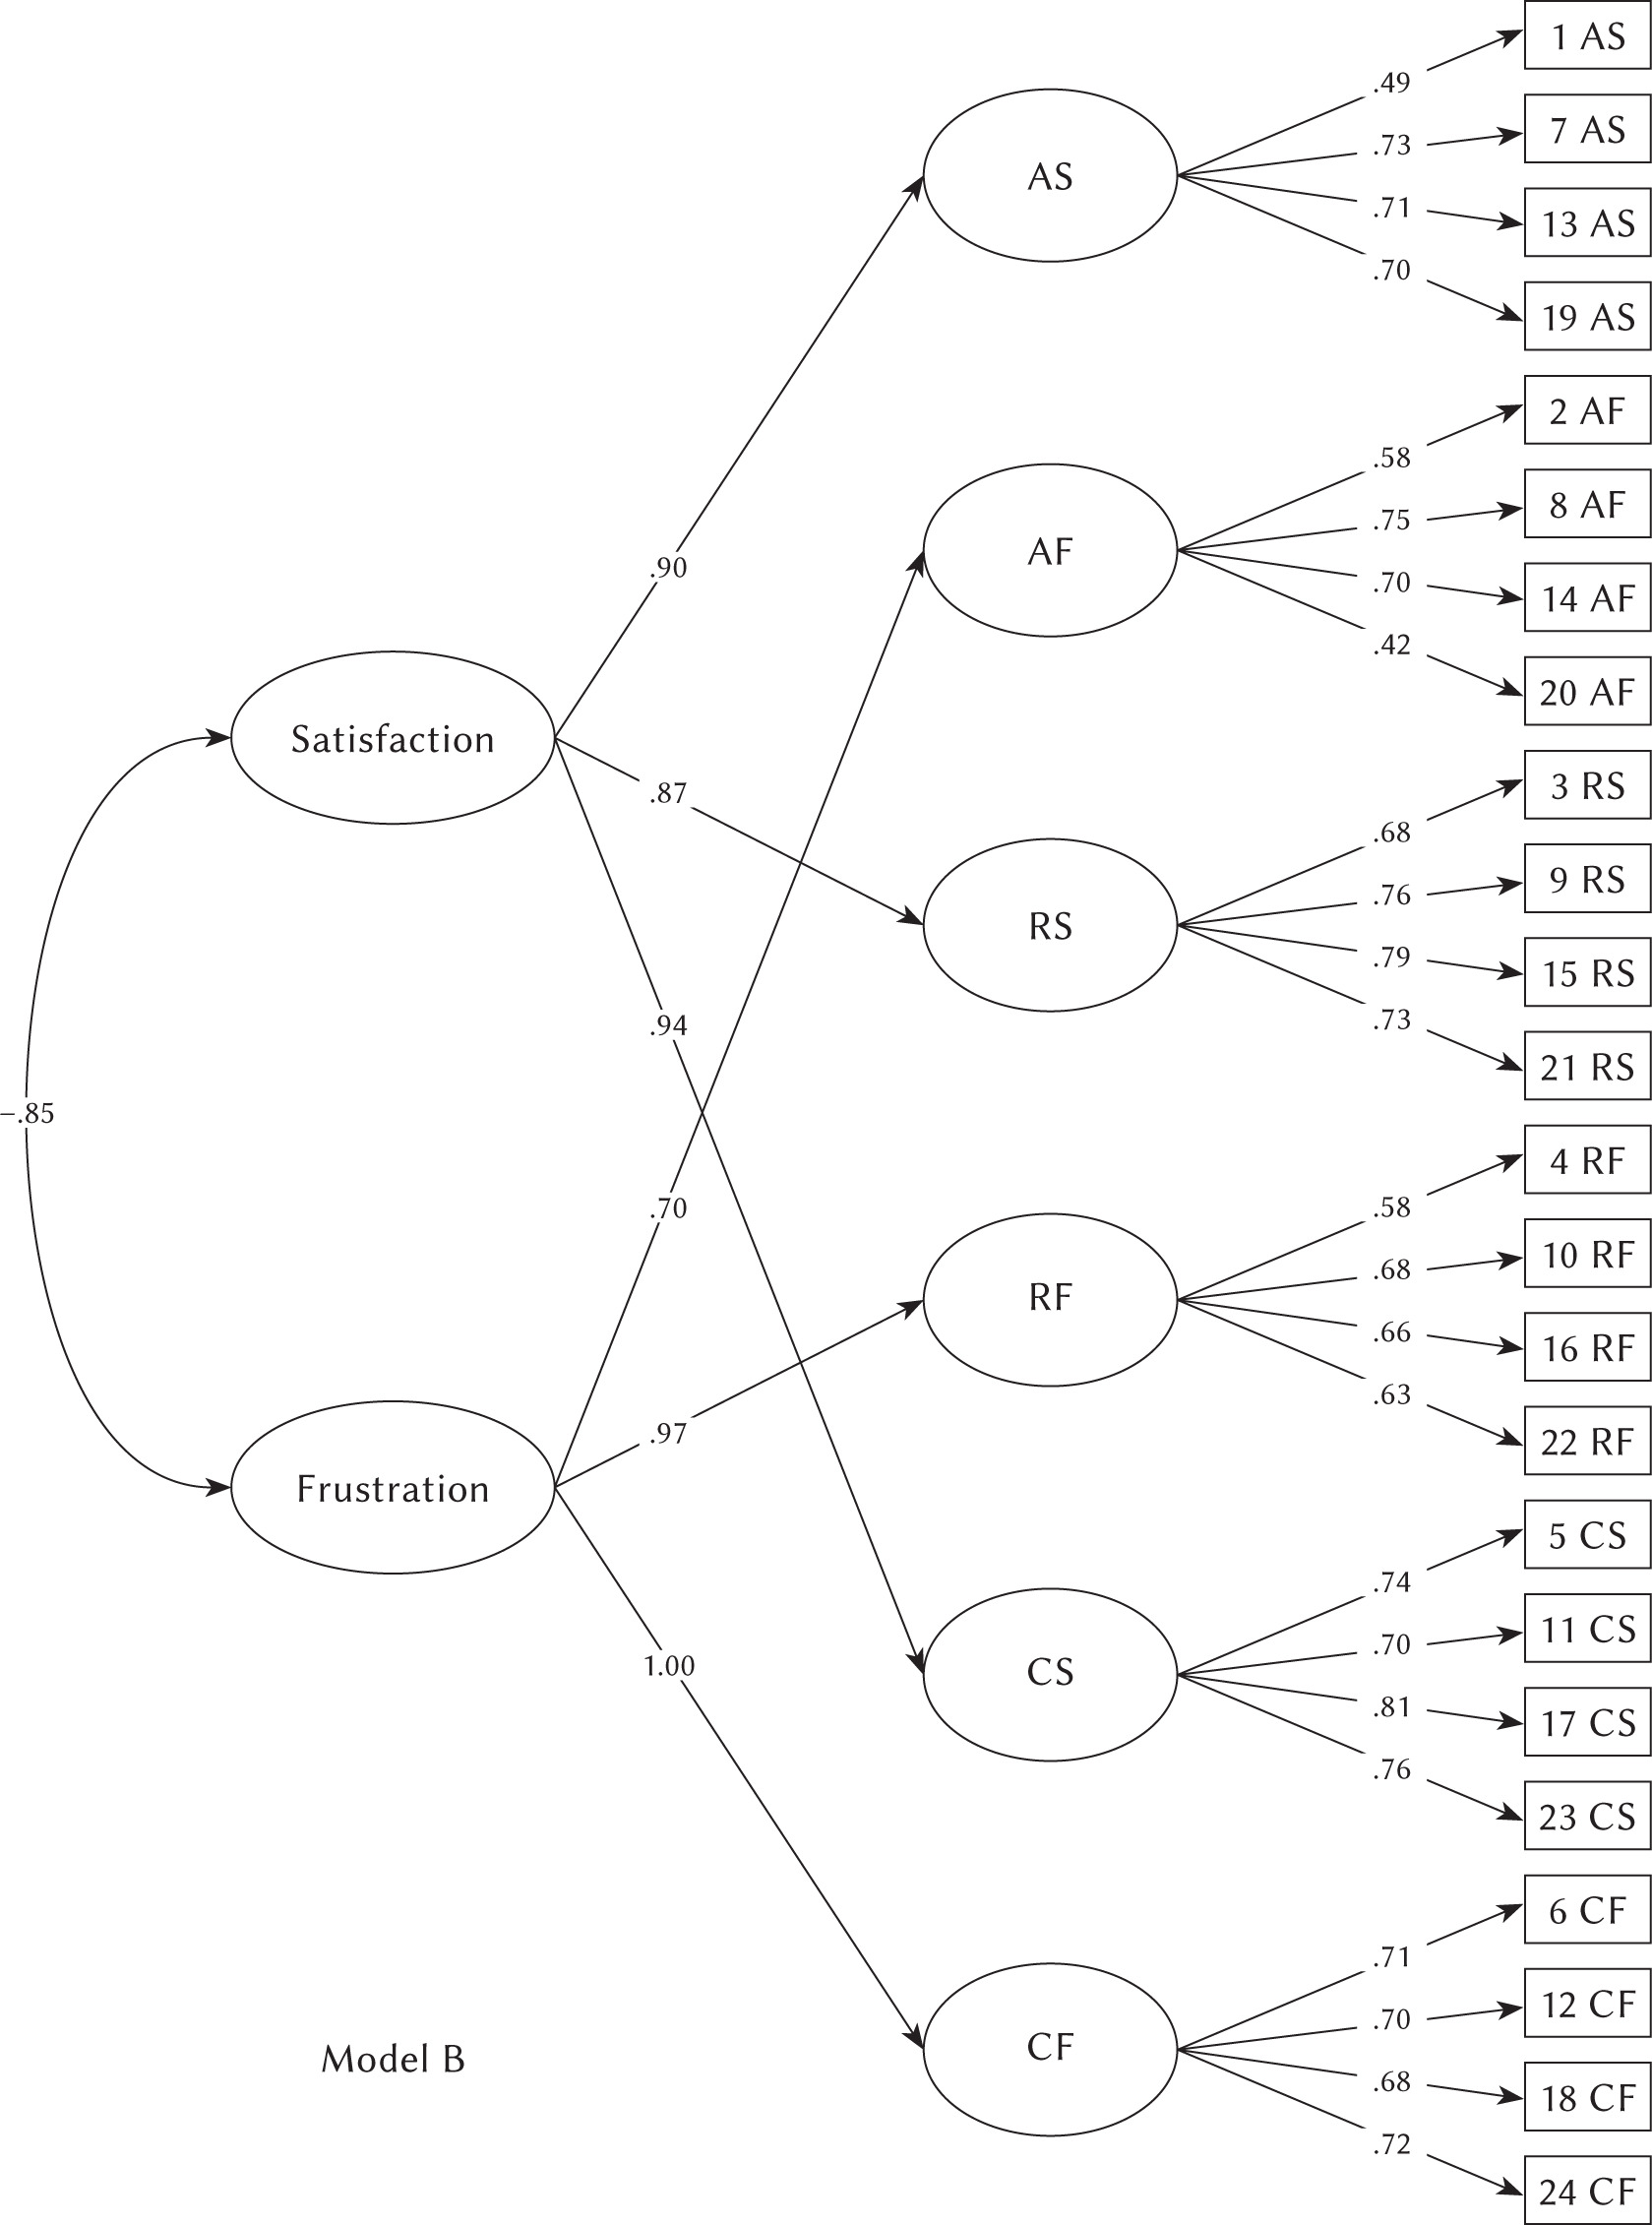
The higher-order model (see Figure 2) assumed the presence of two hidden, higher-order factors: satisfaction and frustration. It consists of the following lower-order factors: the need for autonomy, relatedness, and competence, and they are loaded by explicit variables, i.e. test items. All factor loadings were significant and high (while moderate for two items: 1AS for which β = .49 and 20AF for which β = .42). Each higher-order variable was significantly and very highly loaded by first-order variables. Satisfaction was significantly negatively correlated with frustration.
Figure 2
Higher-order BPNS&FS model
Note. AS – autonomy satisfaction; AF – autonomy frustration; RS – relatedness satisfaction; RF – relatedness frustration; CS – competence satisfaction; CF – competence frustration.
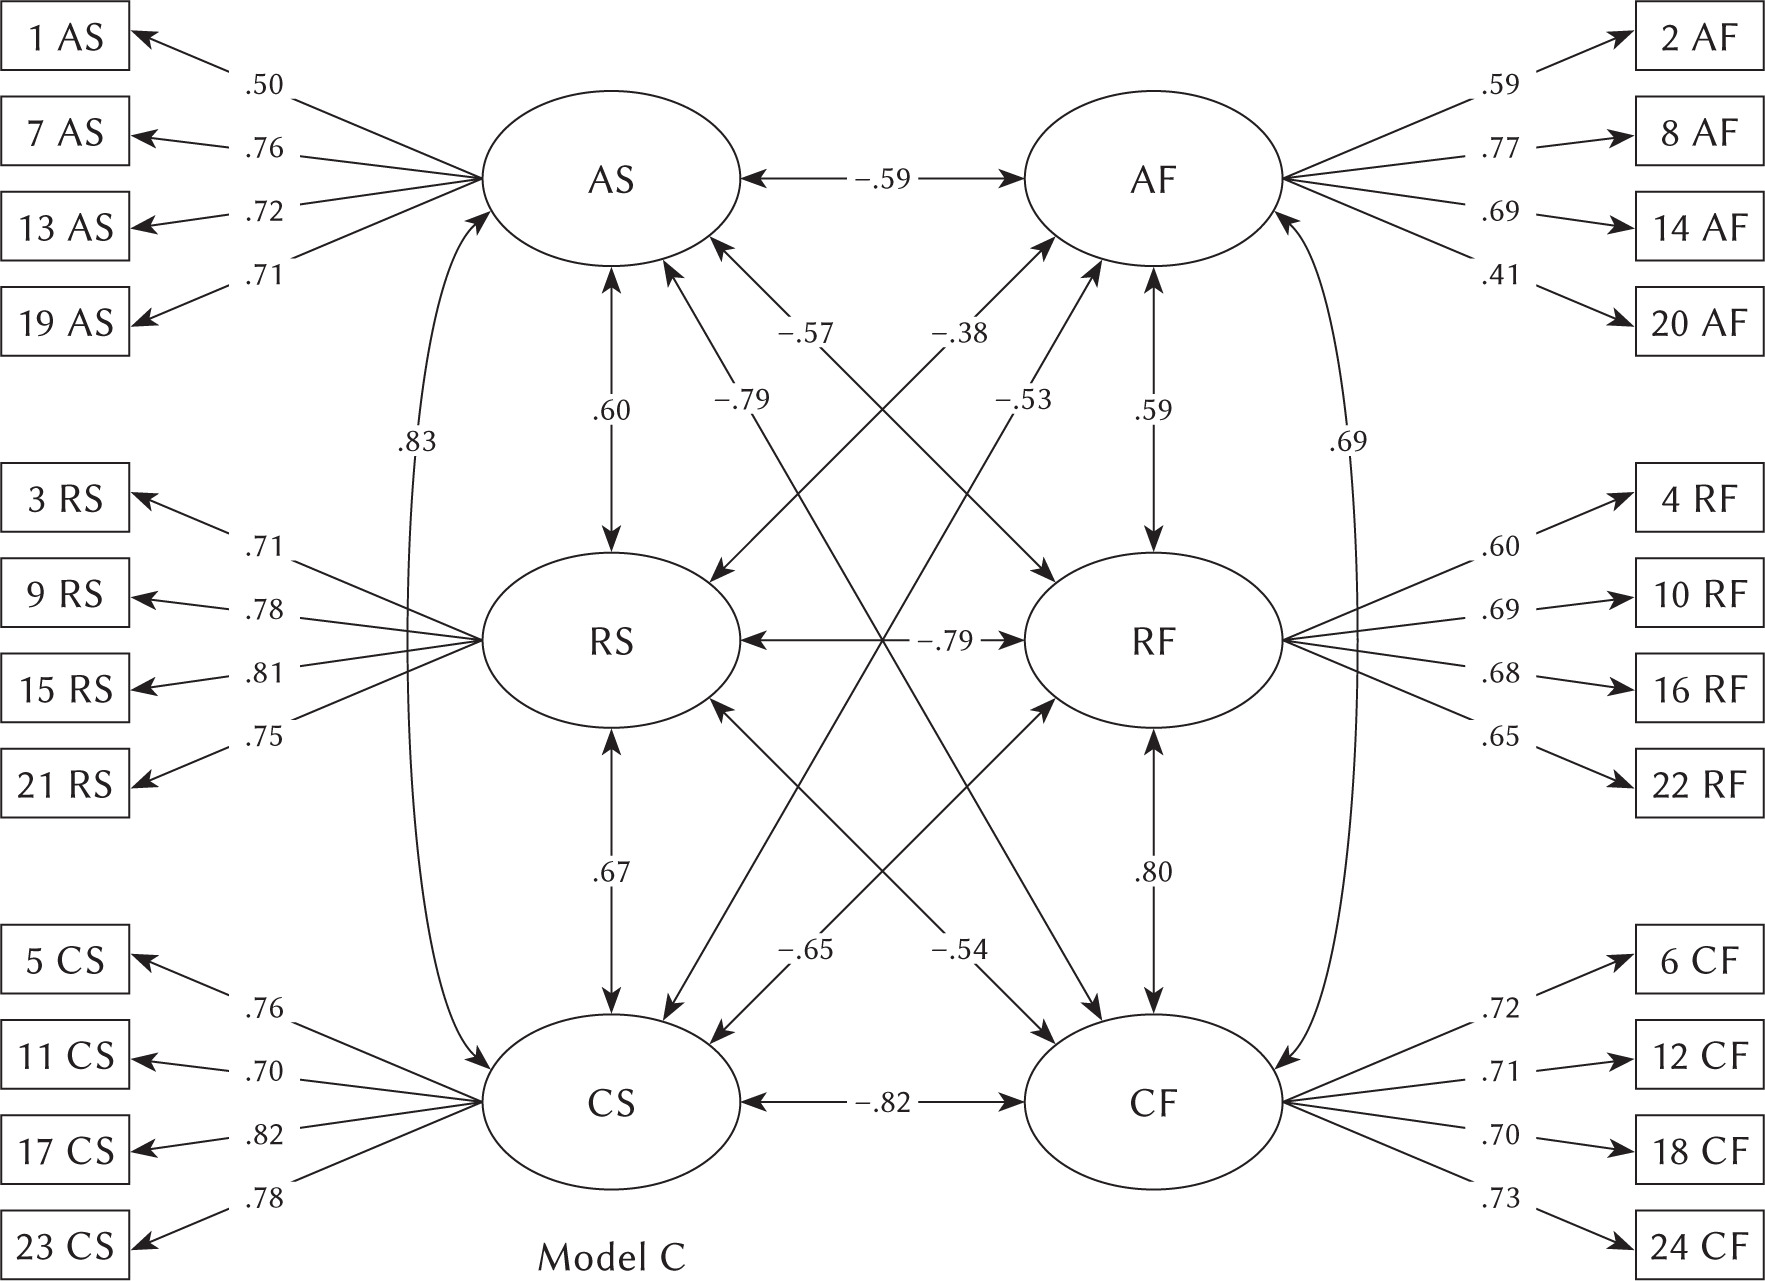
The 6-factor model (see Figure 3) assumed the presence of six hidden variables, separately for the satisfaction and frustration of each need. Each hidden variable was represented by 4 test items. The factor loadings of all items were statistically significant, most β > .70. The weakest (β < .50) again was the loading of item 20AF. All subscales correlated significantly with each other with p < .001; the absolute value ranged from r = .38 to .83. The frustration subscales correlated negatively with the satisfaction subscales, and the subscales within the same dimension were positively correlated with each other.
RELIABILITY
Table 3 contains the BPNS&FS statements with their numbering in the questionnaire as well as the test-retest coefficients (rtr), internal consistency of subscales (Cronbach’s α), and item-total correlation (rit). Test-retest coefficients of results and internal consistency of subscales were either high or very high. The item-total correlation of subscales was generally high, except for items 20 and 2 on the frustration of autonomy subscale, item 1 on the autonomy satisfaction subscale, and item 22 on the frustration of relatedness subscale, for which rit < .50. Nevertheless, they all reached acceptable values (rit > .30).
Table 3
The items and reliability indicators of BPNS&FS
VALIDITY
Table 4 presents the correlations of subscales with validity indicators. All indicators correlated significantly with the BPNS&FS subscales. Psychological well-being correlated positively with the satisfaction of needs and negatively with their frustration. Symptoms of mental health disorders, psychological pain, and involvement in alcohol consumption correlated positively with needs frustration and negatively with their satisfaction.
Table 4
Correlation of validity indicators with BPNS&FS subscales
[i] Note. AS – autonomy satisfaction; AF – autonomy frustration; RS – relatedness satisfaction; RF – relatedness frustration; CS – competence satisfaction; CF – competence frustration; OHQ – Oxford Happiness Questionnaire; GHQA – symptoms of somatic disorders; GHQB – symptoms of anxiety; GHQC – symptoms of behavior disorders; GHQD – symptoms of depression; PS – Psychache Scale; AUS – Alcohol Use Scale. All correlations significant with p < .001.
The analysis of differences in satisfaction and frustration of basic psychological needs between people from the normative sample and patients addicted to alcohol (clinical group) showed significant differences only in terms of the frustration of all three needs. The subjects from the clinical group obtained significantly higher results in frustration of autonomy (Z = –1.99, p < .05), relatedness (Z = –6.09, p < .001) and competence (Z = –6.17, p < .001) than those from the normative sample. There were no significant differences between the groups in terms of needs satisfaction.
A comparative analysis of results obtained with the two Polish versions of BPNS&FS (conducted in the test-retest study), showed a very high correlation of the results from r = .72 for the frustration of competencies to .96 for the frustration of relatedness (p < .001) (see Table 4). Moreover, differences analysis of subscales’ results between both Polish versions of the BPNS&FS, performed on the data obtained from the same twice tested sample, showed no statistically significant differences (all p ≥ .15).
DESCRIPTIVE STATISTICS OF BPNS&FS
Table 5 presents the means, standard deviations, skewness, and kurtosis of the subscales in the whole sample. Moreover, results for women and men are presented along with the results of gender differences. We checked the normality assumption using the Kolmogorov-Smirnov test d. It was found that in each subscale, the results differed from the normal distribution (p < .01) both in the whole sample and in the gender groups.
Table 5
Descriptive statistics of BPNS&FS and the results of test for gender differences
[i] Note. AS – autonomy satisfaction; AF – autonomy frustration; RS – relatedness satisfaction; RF – relatedness frustration; CS – competence satisfaction; CF – competence frustration; M (SD) – mean (standard deviation) in the whole sample: W – group of women, M – group of men; A – asymmetry; K – kurtosis; Z – Mann-Whitney U test; ns – not significant; *p < .05, **p < .01, ***p < .001.
Statistically significant differences were found between women and men, but only in terms of needs satisfaction. Men scored higher than women in terms of autonomy and competence satisfaction, while in terms of relatedness satisfaction, men obtained significantly lower results than women. There were no significant differences between the sexes in terms of the needs frustration.
DISCUSSION
This study aimed to validate the Polish version of the BPNS&FS. After obtaining an equivalent version of the Polish translation of the tool (confirmed by the results of a bilingual analysis of answers), theoretical validity was assessed. Three models that could reflect the theoretical structure of the BPNS&FS were tested using CFA. According to hypothesis H1, the six-factor model was characterized by the best fit parameters, independently distinguishing satisfaction and frustration in terms of each of the three correlated needs (see Table 2 and Figure 3). These results coincide with CFA results of foreign adaptations (Chen et al., 2015; Costa et al., 2017; Heissel et al., 2018) and the version of Kuźma et al. (2020). These results confirm the theoretical validity of the Polish adaptation of the BPNS&FS.
In general, satisfactory reliability parameters were obtained in each BPNS&FS subscale, including test-retest reliability, item-total correlation, and internal consistency (Cronbach’s α) (see Table 3). However, it should be noted that in each of the tested models (see Figure 1-3), three test items (1AS – indicating the satisfaction of autonomy, 2AF and 20AF – indicating the frustration of autonomy) had the lowest factor loadings. These items are also characterized by a lower value of item-total correlation. Nevertheless, the parameters of these items are at an acceptable level (rit > .30). The authors of the original version of the BPNS&FS considered the possibility of removing one item from each subscale, but only if the results obtained in the population of a given country indicated such a necessity (Chen et al., 2015). So it is possible to consider reducing the number of statements to increase the reliability of measurement. However, this problem requires further research.
By verifying the convergent and differential validity of the adapted tool, H2 was confirmed, indicating a positive relationship between the feeling of psychological well-being and its resources with the satisfaction of all three needs, and a negative relationship with their frustration. These correlations were generally high (see Table 5). It can be concluded that the higher the satisfaction of basic psychological needs is, the greater is the feeling of psychological well-being and resources that determine it. Moreover, the higher the frustration of these needs is, the lower is the sense of psychological well-being and potential for happiness. Similar results were obtained using diary analyses, which showed the correlation between the level of perceived well-being and basic needs during the day (Ryan et al., 2010). Research shows that people whose needs are satisfied show a higher level of life satisfaction (e.g. Chen et al., 2015; Heissel et al., 2018; Kuźma et al., 2020; Martin & Hill, 2011; Nishimura & Suzuki, 2016) and they feel better with themselves (Ümmet, 2015), while the frustration of needs negatively correlates with life satisfaction (Chen et al., 2015; Heissel et al., 2018; Kuźma et al., 2020; Nishimura & Suzuki, 2016).
By verifying H3, a positive relationship between psychological pain and frustration of needs, and negative with their satisfaction, was confirmed. This is in line with assumptions of the concept of psychological pain, which states that its sources may be seen in unmet or frustrated psychological needs (Chodkiewicz & Miniszewska, 2014).
The satisfaction of needs had a negative correlation, while frustration positive, with symptoms of mental health disorders – which confirms the fourth hypothesis (H4). Satisfaction and frustration of needs correlated most strongly with symptoms of depression. The weaker the satisfaction and the stronger the frustration, the greater is the severity of depression symptoms. These results are fully consistent with the results of many other studies (Chen et al., 2015; Heissel et al., 2018; Kuźma et al., 2020; Nishimura & Suzuki, 2016). Among the analyzed needs, the frustration of competence was most positively associated with symptoms of mental health disorders, especially with depression. According to research (Fiori et al., 2006; Saltzman & Holahan, 2002), self-efficacy acts as a mediator through which social support influences depressive symptoms. Several studies have confirmed the relationship between the frustration of needs and various types of mental health disorders (e.g. Bartholomew et al., 2011; Campbell et al., 2018; Vansteenkiste & Ryan, 2013).
Research results also confirmed H5, showing a positive but weak relationship between the frustration of needs and the risk of alcohol addiction. The satisfaction of needs was associated negatively and weakly with this risk (see Table 4 for details). Among the analyzed needs, the frustration of the need for competence turned out to be the most positively related to the involvement in drinking alcohol. This result corresponds with the outcome of other studies, which proved that low self-esteem of own coping skills, low sense of self-efficacy, and compensatory use of alcohol to cope with stress are all important predictors of the risk of alcohol addiction (Marlatt, 1999; Poprawa, 2009, 2011).
Referring to the results of the above studies, it was expected (H6) that alcohol-addicted individuals would experience greater frustration of needs than individuals from the normative sample. This hypothesis was fully confirmed. However, no significant differences in needs satisfaction were found between the clinical trial and the normative sample. These results confirm the predicted two-dimensional experience of needs, their satisfaction, and relatively independent frustration, and a better prognostic value of frustration for health disorders (Vansteenkiste & Ryan, 2013). It is mainly the frustration of needs and to a lesser extent the lack of their satisfaction which, under appropriate conditions, may lead to the use of alcohol as a strategy of compensation and escape from negative emotional states (e.g. Burt et al., 2016; Marlatt, 1999; Poprawa, 2009, 2011). Moreover, alcohol dependence has a destructive effect on the psychosocial and health functioning of an individual. It destroys its social and subjective resources, deprives the satisfaction of needs (including relatedness, self-esteem, and competence), and enslaves the individual, taking away a sense of autonomy (Cierpiałkowska & Chodkiewicz, 2020; Marlatt, 1999; Poprawa, 2009, 2011, 2015).
Finally, hypothesis H7 was also confirmed, in which we expected that the results obtained using our version of the BPNS&FS would be equivalent to the results obtained in the study of Kuźma et al. (2020). The results of correlations, as well as the significance of differences analysis, indicate equivalence of results. This also supports the validity of measuring the satisfaction and frustration of basic needs with the BPNS&FS version described here.
Descriptive statistics of results from the normative sample (N = 736) indicate several important points. Firstly, the BPNS&FS score distributions did not match the norm (see Table 5). In terms of needs satisfaction, a negatively skewed distribution was found, which means that there were more high scores than low scores. There was a positively skewed distribution in the frustration of all three needs, indicating that most scores were below average. This means that respondents tend to rate their needs as being more satisfied than frustrated. This is a natural tendency in valuation, known as a positive inclination (Czapiński, 1985). Secondly, women differed from men in terms of needs satisfaction, but not their frustration. Compared to men, they had a significantly less satisfied need for autonomy and competence, but a more strongly satisfied need for relatedness (see Table 5). Previous studies did not analyze gender differences in the intensity of satisfaction and frustration of basic needs (Chen et al., 2015; Kuźma et al., 2020). Our results prove the existence of such differences, which may result from the specificity of cultural roles played by women and men. Women are more community-oriented, which is related to the need for relatedness, while men are agency-oriented, which in turn relates to the need for autonomy and competence (Wojciszke, 2019).
The conducted research, despite the valuable results, has its limitations. It would be ideal to test the results invariance of the original and Polish versions. However, the data obtained by us did not allow such reliable analyses to be carried out. The study sample was neither random nor representative; therefore the results cannot be generalized to the population. Testing a representative sample would be advisable, as the results would allow for the development of standards.
CONCLUSIONS
The obtained results indicate the validity and reliability of the Polish adaptation of the BPNS&FS. The measurement and understanding of basic psychological needs is important in explaining and predicting psychopathology and improving the quality of human life. Research on the BPNS&FS should be continued to remove all the previously discussed weaknesses of the tool. An important challenge is further research on the invariance of the results of both currently existing versions of the tool and/or determining the final content of the item. Summing up, the research results provide grounds for using the adapted method in alternative ways with the already published Polish adaptation by Kuźma et al. (2020).