BACKGROUND
Sensory processing sensitivity (SPS) is a temperamental trait which describes interpersonal differences in environmental sensitivity, both positive and negative (Aron & Aron, 1997; Aron et al., 2012). This trait is characterized by sensitivity to both internal and external stimuli (including physical, social, and emotional stimuli). A standard measure of SPS in adults is the Highly Sensitive Person Scale (HSPS), which has been validated using different methods and within different populations. A research review (Greven et al., 2019) indicated that the concepts of sensory processing sensitivity, differential susceptibility (Pluess & Belsky, 2010) and biological sensitivity to context (Ellis et al., 2011; Shakiba et al., 2019) constitute a subset of a more general theory of environmental sensitivity (Pluess, 2015) which explains individual differences in the ability to perceive and process environmental stimuli.
The consistent degree of interest in research concerning SPS brings about the theoretical development of the concept, and carries a lot of applicative value. The concept is used in the relevant research concerning individual differences in reacting to the environment (Pluess et al., 2018; Tillmann et al., 2018). The research conducted to date shows that this trait may be linked to the risk of psychopathology and the occurrence of stress-related problems (Benham, 2006; Booth et al., 2015; Brindle et al., 2015) when the person grows up, is raised and spends time in an unfavourable, negative environment (Slagt et al., 2016; Slagt et al., 2018a). On the other hand, this trait is related to exceptional benefits when the person grows up, is raised and spends time in positive, supportive environments (Pluess, 2015; Pluess & Belsky, 2010; Pluess & Boniwell, 2015). For this reason, it is important to have reliable and valid tools for the identification of this trait, to conduct research which explores its significance and facilitates its recognition, and finally to adequately support highly sensitive persons. The internationally available and most widely used scale for measuring high sensitivity in adults is the Highly Sensitive Person (HSP) scale. The psychometric properties and validity of the 27-item HSP scale, as well as the shorter version (Acevedo et al., 2014; Lionetti et al., 2018; Pluess et al., 2018; Rubaltelli et al., 2018; Tillmann et al., 2018), have subsequently been validated in multiple studies, including English (Pluess et al., 2018), Norwegian (Grimen & Diseth, 2016), Russian (Ershova et al., 2018), German (Konrad & Herzberg, 2017; Tillmann et al., 2018), Danish (parent-report format; Slagt et al., 2018b), Icelandic (Þórarinsdóttir, 2018) and Japanese (Yano et al., 2020) groups. Therefore, the following is a description of the research concerning the psychometric properties of tools that have been developed to date in order to measure sensory processing sensitivity and environmental sensitivity. A more accurate description of the subject is given by considering the factor structure of the tools. This paper forms part of the body of research which includes testing and exploring the scale for measuring high sensitivity in a Polish sample of emerging adults.
EXPLORATION OF HSPS FACTORS
The results of the analyses conducted to date by many scholars who use HSPS in their research (Evans & Rothbart, 2008; Grimen & Diseth, 2016; Konrad & Herzberg, 2017; Smolewska et al., 2006) have shed new light on the initial claims made by Aron (1997). The HSP scale is the first and the most frequently used scale for evaluating SPS, which was developed over the course of the research conducted in this area. It was developed (together with a theoretical framework for SPS) as a result of exploratory and empirical research. The result of the study is a 27-item HSP scale currently used to evaluate SPS in adults.
The following review of the studies carried out to date was arranged based on the number of factors identified in the research. The first results are those that are compatible with the assumptions of the original version of the unitary sensitivity factor implemented in the United States (Hofmann & Bitran, 2007) and also in England (Neal et al., 2002), then studies were carried out which indicated the presence of two factors, conducted among adults in the United States (Evans & Rothbart, 2008; Rinn et al., 2018), and the most popular, three-factor solutions were included in studies carried out in Canada (Smolewska et al., 2006), but also in Germany (Konrad & Herzberg, 2017) and in Norway (Grimen & Diseth, 2016). Research which supports the presence of four factors was conducted in Turkey (Şengül-İnal & Sümer, 2017) and in England (Meyer et al., 2005); the results are presented in summary and the presentation also includes the five factors which emerged from research in South Africa (May et al., 2020).
Factor analyses based on the results of the HSP scale point to a unitary sensitivity factor (Aron & Aron, 1997). The studies conducted in the context of social anxiety disorder (Hofmann & Bitran, 2007; Neal et al., 2002) confirm the unitary claim. The results were obtained through, among other methods, principal component analysis (PCA) on the basis of scree plot decision (Hofmann & Bitran, 2007). A single factor solution was indicated to be the most parsimonious explanation of the obtained data. The reliability of the single factor scale solution ranged from α = .85 to α = .87 (cf. Aron & Aron, 1997; Hofmann & Bitran, 2007; Neal et al., 2002).
The Evans and Rothbart (2008) study adopts the Velicer MAP criterion and their analysis indicates the benefit of a two-factor structure for the questionnaire. The authors suggest that the HSPS should primarily consist of items reflecting orthogonal constructs of negative affect and orienting sensitivity. They state, however, that the main reason why they prefer the two-factor structure is more conceptual than statistical in nature. Two clearly separate groups of items were used in a study conducted on a group of high ability adults (Rinn et al., 2018). The obtained factors were described as “sensory discomfort” (α = .86) and “orienting sensitivity” (α = .73). Cheek et al. (2009) conducted a study on a group of women and developed a two-factor model whose pattern of loading was similar to the results obtained by Evans and Rothbart (2008). The first factor in their study was named “temperamental sensitivity”, the second “rich inner life” (their respective Cronbach’s α coefficients were α = .86 and α = .66).
A two-factor model was also suggested by a study conducted by Ershova et al. (2018). The operationalization procedure in the Russian version of the HSPS suggests a two-factor model; hierarchical cluster analysis with 13 items creating two subscales: Ease of Excitation and Low Sensory Threshold.
One of the most frequently cited studies was conducted by Smolewska et al. (2006). They collected HSPS data from a large sample (851 students) and conducted an exploratory analysis on half of the sample and a confirmatory factor analysis (CFA) on the second half. The authors showed that concordance coefficients for both the original Aron and Aron model and their three-factor model were certainly acceptable, although the chi-square distribution for the three-factor model was significantly better. The factors extracted from a scree plot were named “low sensory threshold” (LST), “ease of excitation” (EOE), and “aesthetic sensitivity” (AES). These terms have been accepted and are now used in research and in numerous studies (Greven et al., 2019).
The factor structure of a shortened Norwegian version of the HSPS is also best described by the following three factors: EOE, AES, LST. In exploring the structure of the construct and HSPS tool with a group of 167 students, the principal components of the original 27-item version were analysed (varimax rotation). This factor analysis resulted in a three-factor model based on a scree plot and eigenvalue greater than criterion 1. After the items with weak or incoherent factor loadings were eliminated, there remained 13 items corresponding to 55.2% variance (Grimen & Diseth, 2016).
The study conducted by Konrad and Herzberg (2017) on a German-speaking population also confirmed that a three-factor model provided the best fit. It is worth noting, however, that some test items of Aron’s original scale were modified, and also that some new ones were added. The study was thus conducted on a scale consisting of 39 items in total. The three-factor model proposed by the authors had Cronbach’s α values of .93 to .95, as well as a high degree of reliability for all three individual factors.
Other studies conducted using the HSPS indicate the existence of more than three factors. The study of Meyer et al. (2005) resulted in a four-factor model and accounted for 48.4% of variance. The scales were named as follows: general sensitivity/overstimulation (.82), adverse reactions to strong sensations (.88), psychological fine-discrimination (.73) and controlled harm-avoidance (.56). An alternative model was presented in a study concerning a Turkish sample (Şengül-İnal & Sümer, 2017). The results of the exploratory factor analysis was confirmed using traditional CFA and exploratory structural equation modelling (ESEM), which confirmed that the four-factor solution was superior to the other models. May et al. (2020) conducted a study on a group of ethno-culturally diverse South African students. They proposed a 5-factor solution as a best fit: negative affect, neural sensitivity, propensity to overwhelm, careful processing and aesthetic sensitivity. Other, two-factor solutions, proved sufficient, but only based on Vuong’s test, the five-factor model is regarded to be a much better fit than a bifactor model (May et al., 2020).
In summary, the HSPS (Aron & Aron, 1997) measures high sensitivity based on a 27-item questionnaire with the answers based on a 7-point Likert scale. It should be noted that some of the researchers referred to above used modified versions of the HSPS (e.g. Evers et al., 2008; Grimen & Diseth, 2016; Konrad & Herzberg, 2017; Smolewska et al., 2006) in their studies. The authors eliminated from the final list certain items based on their low factor loadings or the high correlations between them. Thus, we are referring to material which is not equivalent to the original material due to the changes introduced as a result of statistical analyses.
PARTICIPANTS AND PROCEDURE
The Polish adaptation of the HSPS questionnaire (Aron & Aron, 1997) was conducted in a cross-sectional study using a 27-item version of the scale translated into Polish using a back-translation procedure. This was carried out through a double translation procedure under the supervision of experts in both languages. Items were culturalised with sufficient care being taken to retain the original meaning of each one. Firstly, the questionnaire was translated independently by two qualified psychologists experienced in psychometrics. The translation was then proofread and back-translated into English. The process was repeated and the final version was then edited by a team of psychologists proficient in English so as to fully fit into the Polish cultural context. The participants of the study were asked to respond to questions based on a 7-point Likert scale.
The analysis included the complete answers of 470 persons. Setting the alpha level at .05, and expecting a medium effect size (Cohen’s d = .5), we assumed minimal statistical power P = .8 (Cohen, 1988). The recommended ratio of cases per indicator variable to achieve desired power in exploratory factor analysis (EFA) ranges from 5 to 20 (Dimitrov, 2011). The total sample size calculated according to the above assumptions for 27 questions and EFA ratio cases to variables c./v. = 15 is N = 405. The recommended sample size for item parameters estimation in the graded response model is N = 500 (Jiang et al., 2016; Reise & Yu, 1990). The recommended number of cases based on Monte Carlo simulation studies in a CFA (Kyriazos, 2018) is at least N = 315. Validation in a bivariate correlational model with expected correlation coefficients from .2 to .8 expected from similar studies (Montoya-Pérez et al., 2019; Oxtoby et al., 2016; Rinn et al., 2018) requires a minimum sample size of N = 319 (Faul et al., 2007). Adding 1/4 to the highest requested sample size (N = 500) due to possible data loss resulted in N = 625, and finally, 638 persons participated in the study. However, the number of partially incomplete answers was 168, which is 8.6 percentage points above expectations. A pilot study phase was carried out before the full application of the instrument.
Simple cluster sampling, with probability proportional to population size of academic year groups, was performed. Ethical approval was granted by the Bioethical Commission at the University of Economics and Innovation in Lublin (No. 2019/12/16). The sample was gender-balanced with a slightly higher number of women (NK = 257; 54.7%). The age of the respondents ranged from 18 to 25 years (M = 21.38, SD = 1.92), with no significant differences between the sexes (MK = 21.23, SDK = 1.83; MM = 27.57, SDM = 2.01; zU(470) = 1.94, p = .052). The data collected in the cross-sectional study were classified in an EFA and verified using item response theory (IRT) and CFA.
The initial HSPS items correlation matrix analysis indicated that each question correlated with at least one other question from the scale at .27 to .75, which revealed a pattern in how the questions were answered. In order to check the factor structure of the Polish version of the scale, the answers were analysed through the EFA, based on the classical test theory (CTT). The value of the Kaiser-Meyer-Olkin test exceeded the limit value of .6 (KMO = .89), whereas Bartlett’s test of sphericity was significant (χ2df = 351 = 4413.6, p < .001), which confirmed the adequacy of the sample chosen for factor analysis. Considering the probable significant links between the HSPS factors extracted to date (Aron & Aron, 1997; May et al., 2020) and in order to evaluate the factor structure of the Polish version of the scale, principal axis factoring (PAF) with oblique (oblimin) rotation (δ = 0) was applied.
The unidimensional sets of questions obtained with factor analysis were verified based on IRT. The size of the sample which consisted of fewer than 500 persons as well as the span of the Likert scale used by the participants to give their answers suggested the practicality of a one-parameter model (Reise & Yu, 1990). The levels of difficulty and discrimination of questions, as well as the general information value of the factors and questions, were evaluated.The last step in the evaluation of the psychometric properties of the Polish version of the HSPS was to conduct a CFA in order to verify the fit of the models obtained in the research to the gathered data. The version of the scale with the best fit was evaluated as to its information value in the IRT model and complemented with the Cronbach’s α reliability coefficients based on CTT. The criterion validity of the scale was also verified through juxtaposing it with the results of the Pavlovian Temperament Survey by Strelau and Zawadzki (2018), known in Poland as the Temperament Questionnaire, and subsequently adapted abroad as the Strelau Temperament Inventory (Strelau, 1983). The questionnaire consists of 57 statements with three scales: Strength of Excitation (SE), Strength of Inhibition (SI), Mobility of Nervous Processes (MO) as well as the Balance of Nervous Processes (BA). The reliability of the questionnaire is satisfactory with α coefficients ranging from .71 to .83. The tool was chosen because it is valued due to the role that the measured properties play in the process of human adaptation to the surrounding environment but also because of the fact that it originated in Poland (and yet it has been used in more than 20 countries).
RESULTS
STRUCTURE OF THE FULL VERSION OF THE HSPS
An analysis of the scree plot depicted in Figure 1 indicates that a three-factor solution can be adapted, as well as four- or five-factor solutions (Ledesma et al., 2015). Adapting the Kaiser numerical criterion, which equals 1, a preliminary 5-factor solution was obtained and analysed further. The extracted factors were weakly correlated (rmax = .31). The eigenvalue and the percentage of variance accounting for individual factors are shown in Table 1. The 5-factor solution accounts for 52.87% of the total variance in the test items. The rotation reached convergence in 26 iterations. The cumulative sum of the squared factor loadings after extraction is 43.05%. The pattern matrix is presented in Table 1.
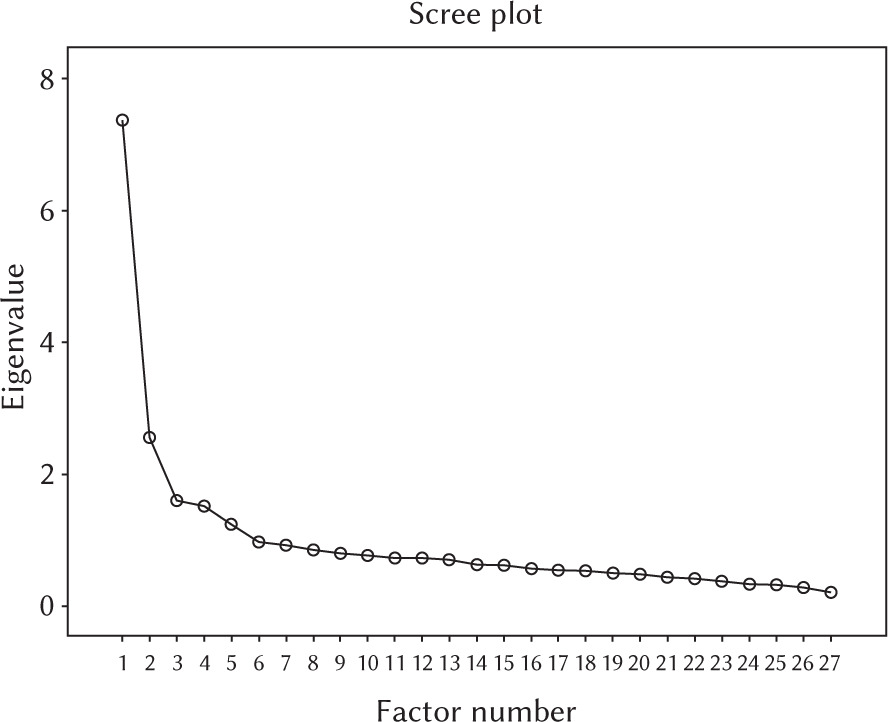
Table 1
Eigenvalues of the components of the 27-item version of the HSPS and the percentage of common variance explained by the components in a 5-factor solution (EFA – principal axis with oblimin rotation; δ = 0)
Five questions (items 5, 6, 11, 19, and 27) are loaded at a similar level (difference smaller than .15) by two factors or have a loading below the minimal established threshold = .32 (Worthington & Whittaker, 2006). What is more, the communalities of items 4, 15, and 20 are below the established threshold.
Table 2
Pattern matrix for 5 factors extracted from the 27-item Polish version of the HSPS
[i] Note. HSPS – Highly Sensitive Person Scale; a the question numbers are in line with the original version of the HSPS; b the underlined values are those factor loadings whose value in a different factor was less than .15 and different from the main factor, and also below the minimal threshold value or if the common variance of the question was below the threshold; c the factor loadings in bold are those with a value exceeding .32 in items with no cross-loading, with a high common variance included in the HSPS.
Eigenvalues and variance were explained through extracting components of the model before rotation, which indicates that most of the variance is accounted for by the first factor. The distribution of eigenvalues and the percentage of variance after oblique rotation suggests a 5-factor solution where the fifth factor has a lower loading than the remaining factors. The 5-factor solution consists of 19 items grouped into scales whose reliability in CTT (Cronbach’s α) is given in parentheses:
Factor 1: 14, 16, 21, 23, 24, 26 (αC = .83),
Factor 2: 2, 8, 10, 12, 17, 22 (αC = .74),
Factor 3: LST: 7, 9, 25 (αC = .80),
Factor 4: 1, 3 (αC = .64),
Factor 5: 13, 18 (αC = .56).
PROPERTIES OF QUESTIONS IN THE HSPS
The properties of the questions in the HSPS were evaluated using the information value criterion as it is understood in IRT. The evaluation of questions in the IRT model was conducted using questions which fulfilled the criteria in the factor analyses presented above (Worthington & Whittaker, 2006). Information values of 19 questions as well as their parameters in the IRT model (i.e. difficulty and discrimination) are presented in Table 3.
Table 3
Information value, difficulty and discrimination parameters in a 19-question version of the HSPS
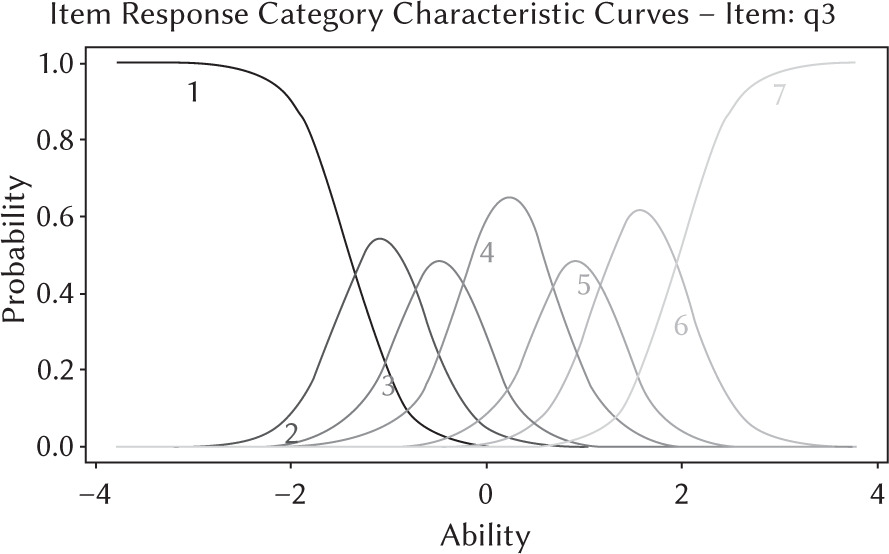
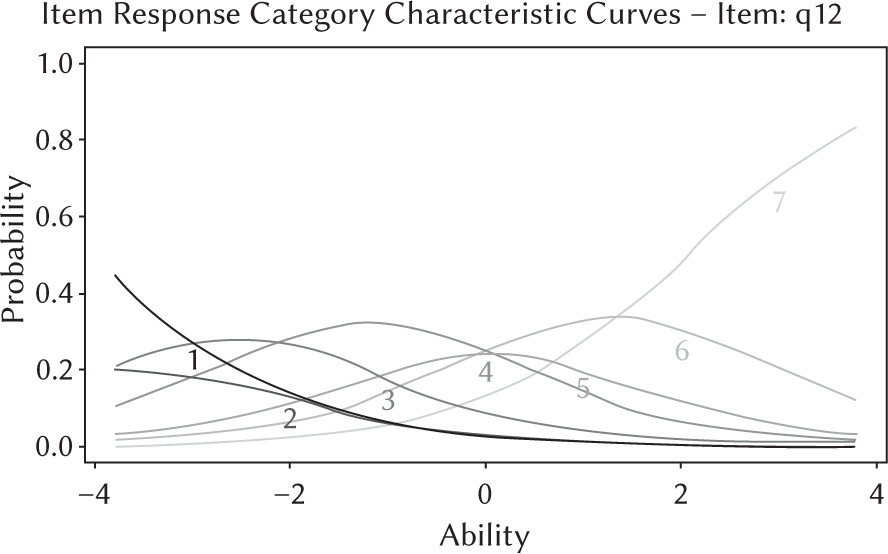
The total information value of 19 questions explains 63.47% of variance in results. The information value of 19 questions within the range of ±4 standard deviation from an average value of the property was 57.69, i.e. 90.89% of the total information value. The parameters are satisfactory; however, the differentiation of the information value of the individual questions was significant. A group of questions with an information value of below 3.5 clearly stands out from the others. The highest information value was achieved by question 3, and the lowest was attributed to question 12. To illustrate the differences in the information value of the questions, the curves characterizing the probability of the occurrence of certain categories of answers from 1 to 7 with a specific value of the measured property are shown in Figures 2 and 3.
SHORT VERSION OF THE HSPS
Due to the specific nature of high sensitivity as an object of measurement as well as the uneven structure of the 19-item tool, an attempt was made to shorten the scale in order to lower the level of stress of the respondents (cf. Benham, 2006). The starting point to reduce the number of questions was the analysis of the structure of factors and psychometric properties of the Polish version of the HSPS presented above. Thus, a set of 10 questions was incorporated into the shortened version. Items with an information value above 3.5% were left. As a consequence, items numbered 1, 2, 3 (the only ones remaining in the factor), 7, 12, 13 (the only ones remaining in the factor), 18 and 24 were eliminated. As a result, the number of factors was reduced to three and the number of questions in each factor was also reduced. The 3-factor solution consists of items grouped into scales whose reliability in CTT is given in parentheses:
Factor 1 – EOE: 14, 16, 21, 23, 26 (αC = .83),
Factor 2 – AES: 8, 10, 22 (αC = .69),
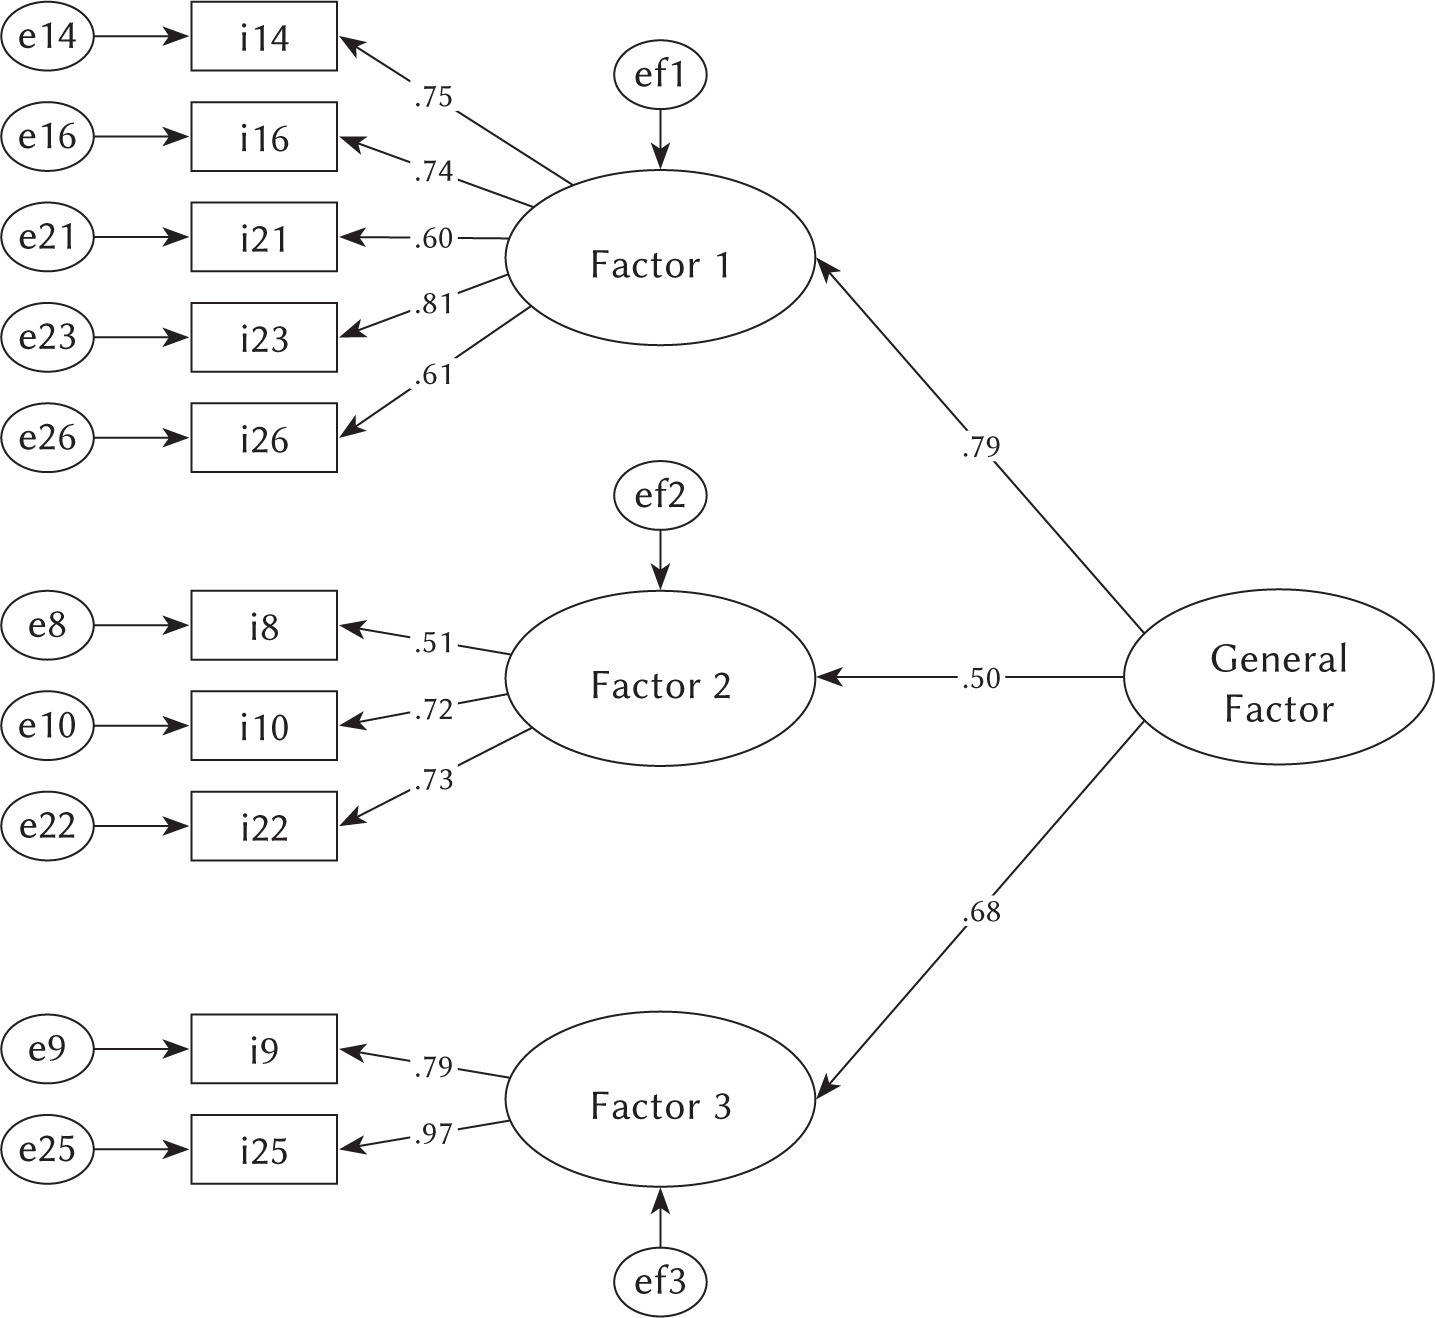
Factor 3 – LST: 9, 25 (αC = .86).
The total information value of 10 questions explains 43.94% of the variation of the results. The information value of 10 questions within the range of ±4 standard deviations from the average value of a property is 41.94, i.e. 95.44% of the total information value. The factors included in this model explain 66.49% of the cumulative variance of test items in verifying factor analysis. The total sum of the squared loadings is 53.99%.
VERIFICATION OF THE HSPS STRUCTURE
The results of the CFA illustrating the fit to the data of 5-factor and 3-factor models are shown in Table 4. The value of the RMSEA index in the 5-factor solution indicates a mediocre fit (MacCallum et al., 1996). The significant value of the unilateral PCLOSE test indicates, however, that RMSEA may have worse properties. The 3-factor version of the HSPS, consisting of 10 questions, shows an excellent fit to the data. The information value of the 3-factor solution shows that this version has significantly lower unexplained variation in results, compared to the 5-factor solution. The level of PCLOSE indicates, with a high degree of probability, the good fit of the 3-factor model to the data. It should be noted that the 3-factor model encompasses a smaller range of properties related to high sensitivity, compared to the 5-factor model, which results from fewer scales.
Table 4
The fit of the complete and shortened versions of the HSPS to the data based on confirmatory factor analysis
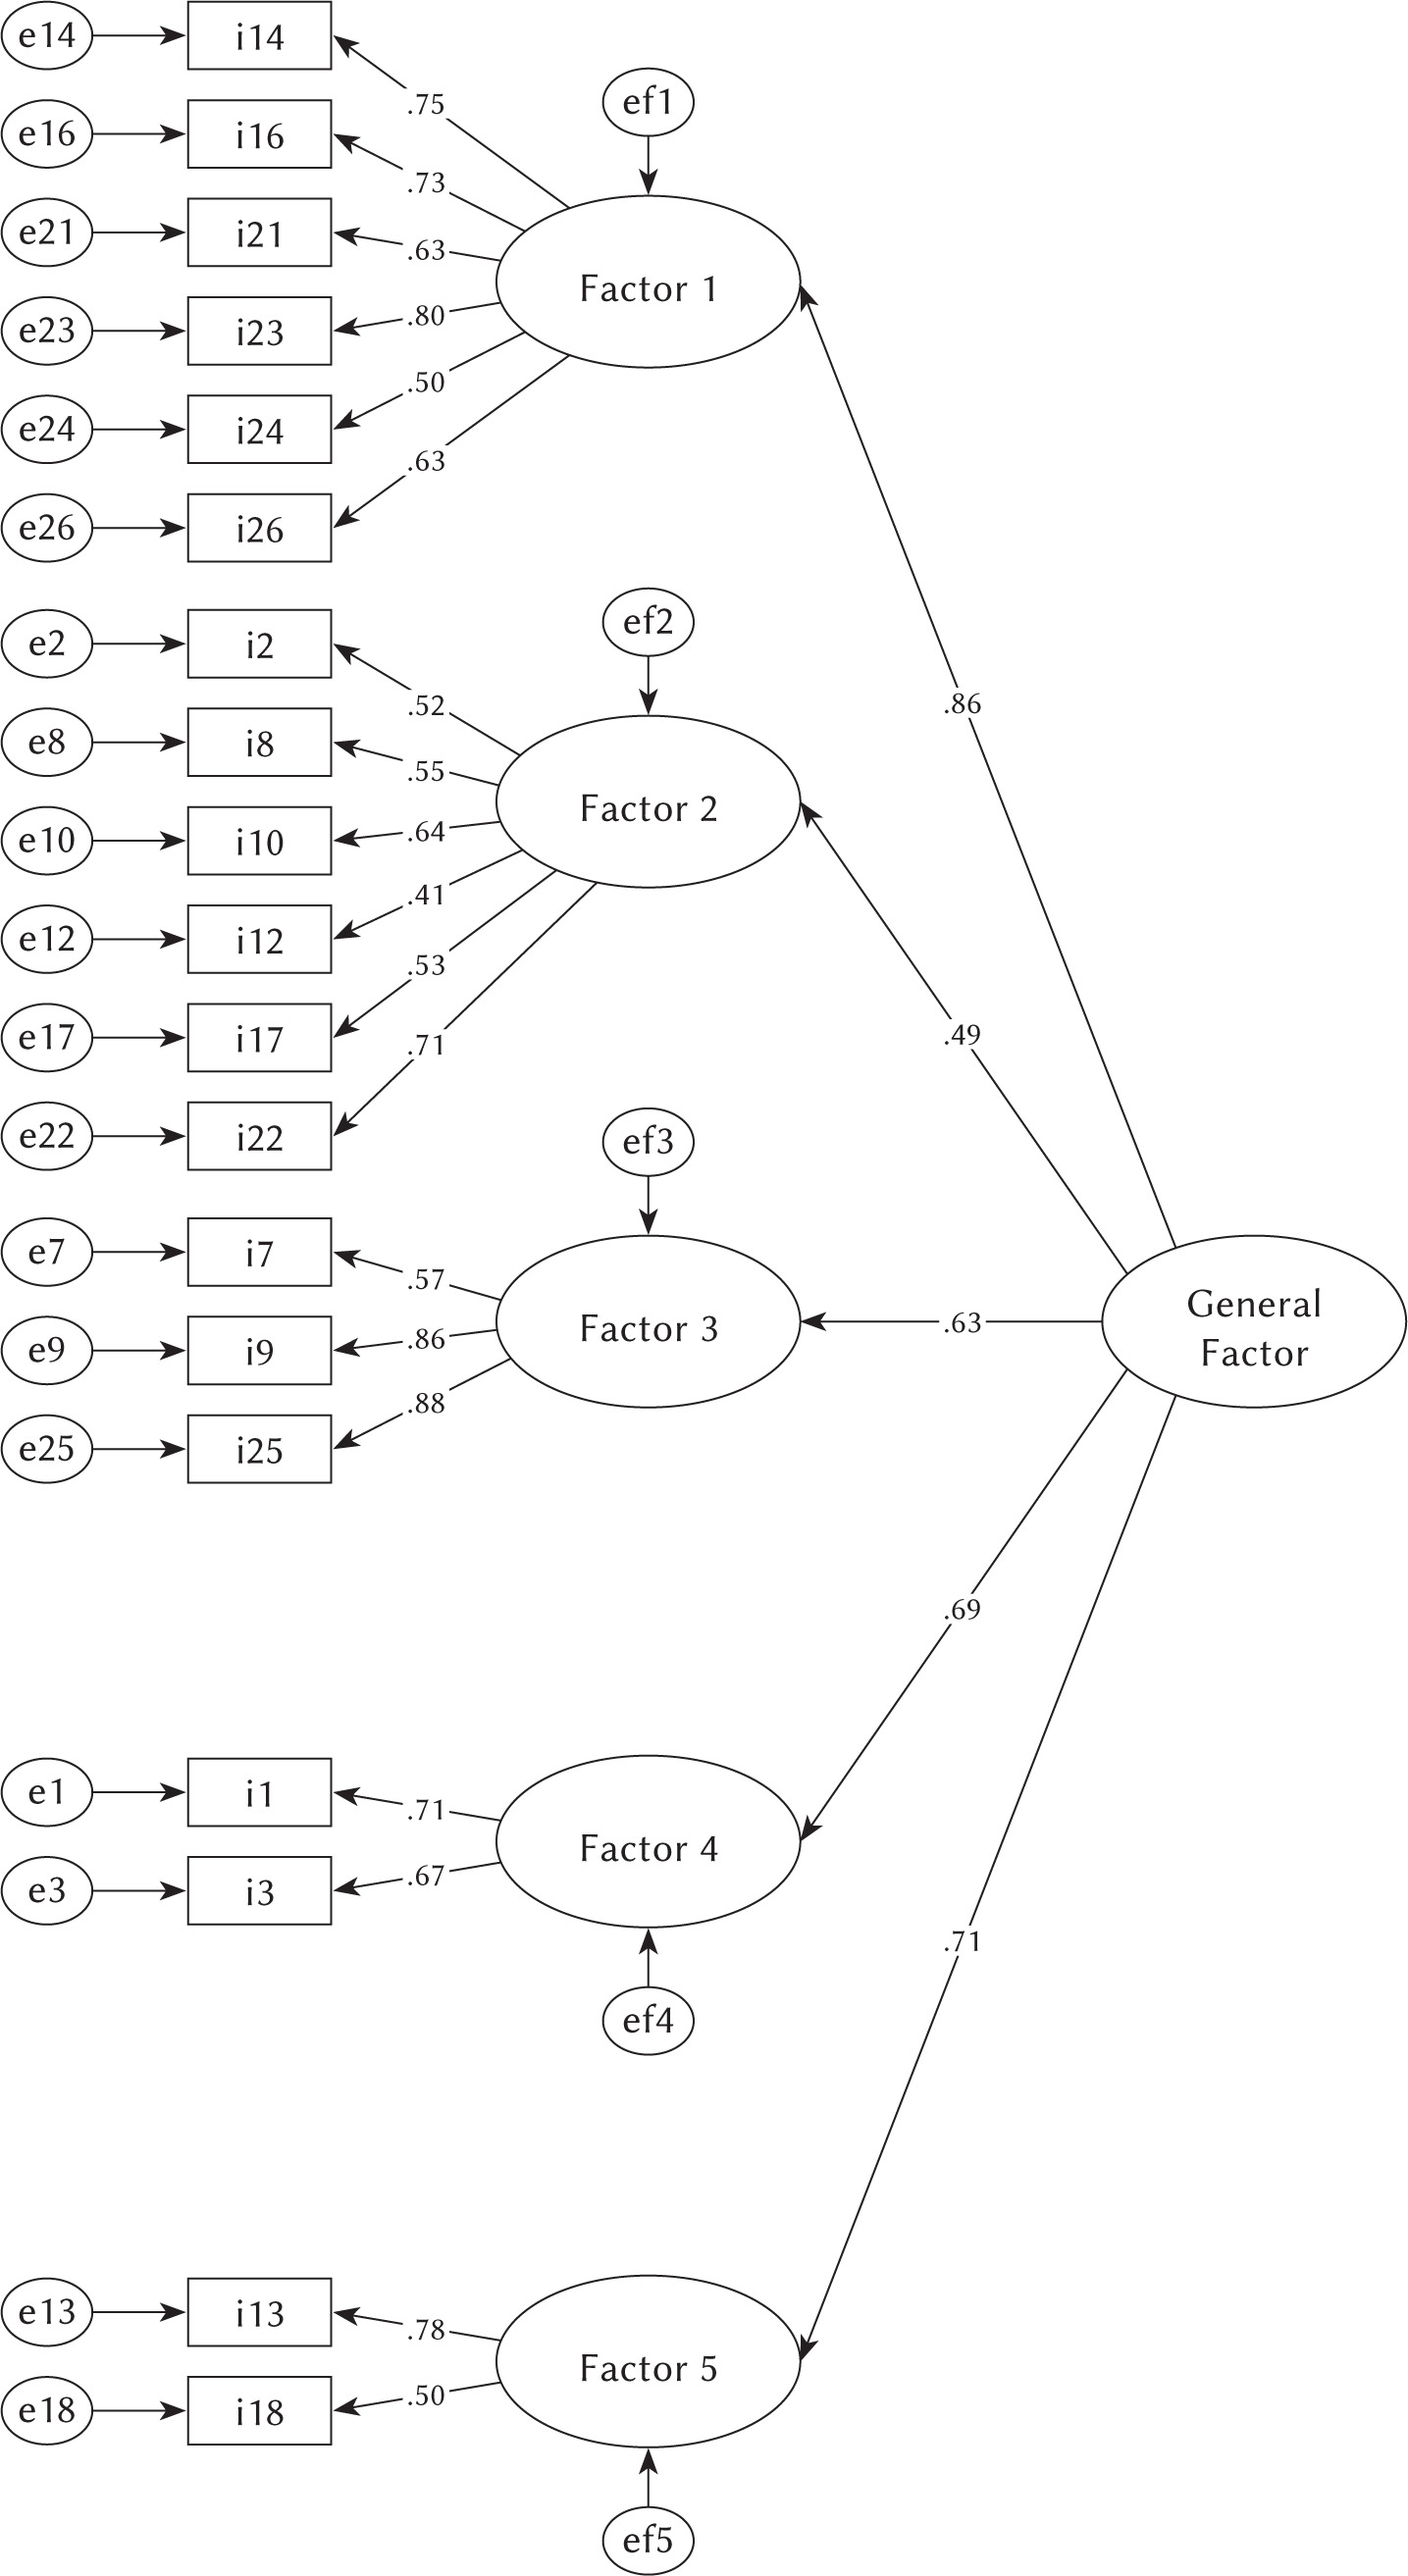
A second order factor analysis conducted on aggregate results of the scales extracted in the 5-factor and 3-factor models leads to the extraction in each of these solutions of a single second order factor. The fit of the models including the second order factor are slightly better, compared to the output models, as represented in Table 4.
Adding the second order factor facilitates the calculation of the general result of the scale, which is a measure of the general level of sensory processing sensitivity. The internal structure of the HSPS based on the 5-factor model is presented in Figure 4. The 3-factor model, which is the best fit to the data, is presented in Figure 5. Both solutions are included in the validity analysis of the Polish version of the HSPS presented in the following section.
DISTRIBUTION OF RESULTS OF THE SCALES IN THE POLISH VERSION OF THE HSPS-P
The distribution of the results for women and men in all of the HSP scales, apart from the results of the total sum of the points in the 5-factor version, deviates from the normal distribution. Typical results obtained from the respondents of individual scales in the Polish version of the HSPS are represented in Table 5. Women obtained significantly higher results in all of the dimensions of the HSPS than men did.
Table 5
Mean summary scales’ results distribution in the Polish version of the HSPS
VALIDITY OF HSPS
The validity of the HSPS was estimated based on the correlation of its results with the results of the Pavlovian Temperament Survey (PTS). The results obtained in the PTS were juxtaposed with the results of the HSPS in both variants presented above; the correlation coefficients are presented in Table 6.
Table 6
Validity of HSPS – links between results of HSPS and results of PTS
Almost all of the dimensions of the HSPS are significantly correlated with all of the scales of the PTS. The general level of sensitivity and its individual dimensions are mainly linked to the Strength of Excitation (SE). Higher HSPS values correlate with a lower resistance to strong or long-lasting stimulation. A similarly strong relationship was noted with the EOE factor. This result, as well as significant correlations between the HSPS result and the strength of conditional inhibition, the balance of nervous processes and the mobility of nerve processes, confirms the validity of the HSPS.
DISCUSSION
The research conducted to date has not definitively answered the question as to whether a high degree of sensitivity is a unidimensional construct, or whether it is composed of multiple factors (Evans & Rothbart, 2008; Konrad & Herzberg, 2017; May et al., 2020; Smolewska et al., 2006). The research conducted in order to verify the psychometric properties of the HSPS as well as exploring its characteristics within a sample of Polish emerging adults resulted in two solutions, neither of which is unidimensional. The first proposed solution, which indicates 5 factors, does not correspond to the results of the other 5-factor models (May et al., 2020). The first three factors map onto the three factors extracted by Smolewska et al. (2006) or Grimen and Diseth (2016), while factors 4 and 5, encompassing 2 questions each, do not recreate the structure of either of the solutions proposed to date. Factor 4 includes question 1 – which is related to being overwhelmed by stimuli – this question was not included in the studies conducted in the USA and Norway (the study on a Turkish sample includes the “sensitivity to external stimulus” factor), as well as question 3, which is related to being affected by the moods of other people. In the analyses of Smolewska et al. (2006) these two items that constitute our factor 4 fall into the same category as the EOE factor, while according to May et al. (2020) they fall into the same category as the “neural sensitivity” factor and according to Şengül-İnal and Sümer (2017) they fall within the scope of “aesthetic sensitivity”. Factor 5, in turn, links questions related to experiencing arousal, such as being startled or frightened easily or to avoiding violent movies. It might be interpreted as being “jumpy”, nervous or agitated. Linking these two factors seems to make substantive sense, although in other studies (Smolewska et al., 2006) these questions were included as an aspect of EOE and LST or as an aspect concerning “sensitivity to external stimulus” and “harm avoidance”. This fact may result from cultural sensitivity (manifested perhaps, in different linguistic expressions) which places emphasis on different aspects of the issue.The best solution, from the point of view of psychometric analyses and substantive consistency, seems to be the one which reduces the number of test items that differentiate the sample least effectively. In this way, a shortened, 10-item scale is created. The results of its analysis indicate an excellent fit to a 3-factor model structure that distinguishes EOE, AES, and LST. It is the most common solution which is supported by psychometric analyses and coherent conceptual assumptions (Greven et al., 2019; Grimen & Diseth, 2016; Pluess et al., 2018; Smolewska et al., 2006), and at the same time it would appear to be adequate for recommendation and further application. The shortened version was also used in the Norwegian study (Grimen & Diseth, 2016).
An analysis of differences between the genders revealed significant differences between men and women concerning all factors (both for the 5-factor and 3-factor version). The results obtained by women showed significantly higher average values and similar dispersions for all factors and higher general values, compared to the men’s result. This is in line with the results of other studies conducted by Aron and Aron (1997), Smolewska et al. (2006) and Blach and Egger (2014).
The results of the correlational analyses between the Polish version of the HSPS and a tool for diagnosing basic behavioural characteristics of the nervous system (Strelau & Zawadzki, 2018) suggest that strength of excitation (SE) is the factor most strongly associated with the component of EOE, similarly to the 10-item HSPS general result. This relationship is inversely proportional and indicates that being overwhelmed by stimulation co-occurs with the tendency to discontinue an activity. A lack of correlation was noted in the case of the LST component. Similar results, despite being based on the BIS scale, were obtained in other studies (Aron & Aron, 1997; Smolewska et al., 2006). The higher the result for the PTS components is, the greater is the ability to maintain excitation or conditioned inhibition, changeability and adequacy of reaction, and this co-occurs with a lower HSPS result. The studies conducted to date which explore the characteristics of the HSPS differed depending on the nationality of the respondents and the sample size (also its homogeneity), which may also be a factor that limits the possibility of comparing the results adequately (Ershova et al., 2018; Grimen & Diseth, 2016; Konrad & Herzberg, 2017; May et al., 2020). The analysis of the properties of the scale and its components for different nationality studies shows the importance of cultural differences. The results cannot be easily compared to other adaptations, as their authors introduced modifications to some of them. The revealed tendencies suggest that some items may require adaptation to different cultural sensitivities while maintaining an accurate evaluation of SPS (Greven et al., 2019).
LIMITATIONS AND FUTURE RESEARCH DIRECTIONS
HSPS is a relatively new scale in Europe and its application to the study of the Polish population has been conducted for the first time. For this reason, there are several aspects which require further investigation. Firstly, the study was conducted on a relatively homogeneous sample (i.e. persons in their emerging adulthood); therefore future research should include a more heterogeneous sample (at least with reference to their age group). Further analyses are also required to establish the importance of gender (in the studies conducted to date women obtained significantly higher results). Secondly, longitudinal studies investigating the relationship between SPS and other temperament and personality features (e.g., the Big Five) more closely, as well as other HSPS correlations (for example, cognitive functioning), would be important and beneficial in terms of understanding the trait. A further analysis of the SPS factors with different dimensions of personality and temperament would also be valuable. Thirdly, an additional investigation of cultural differences in this trait would be valuable.